Dataset Management
Once you’ve successfully created your dataset, our platform offers a range of tools to manage and optimize your data. The dataset creation process begins on the backend as soon as you click Create. You will receive notifications about the progress of your dataset via email and platform notifications.
After processing, your datasets will be available on the Dataset Dashboard. By clicking on the dataset name in dataset table, you’ll be taken to the dataset’s management page, where you can perform several actions across different tabs.
Dashboard View
1. Summary
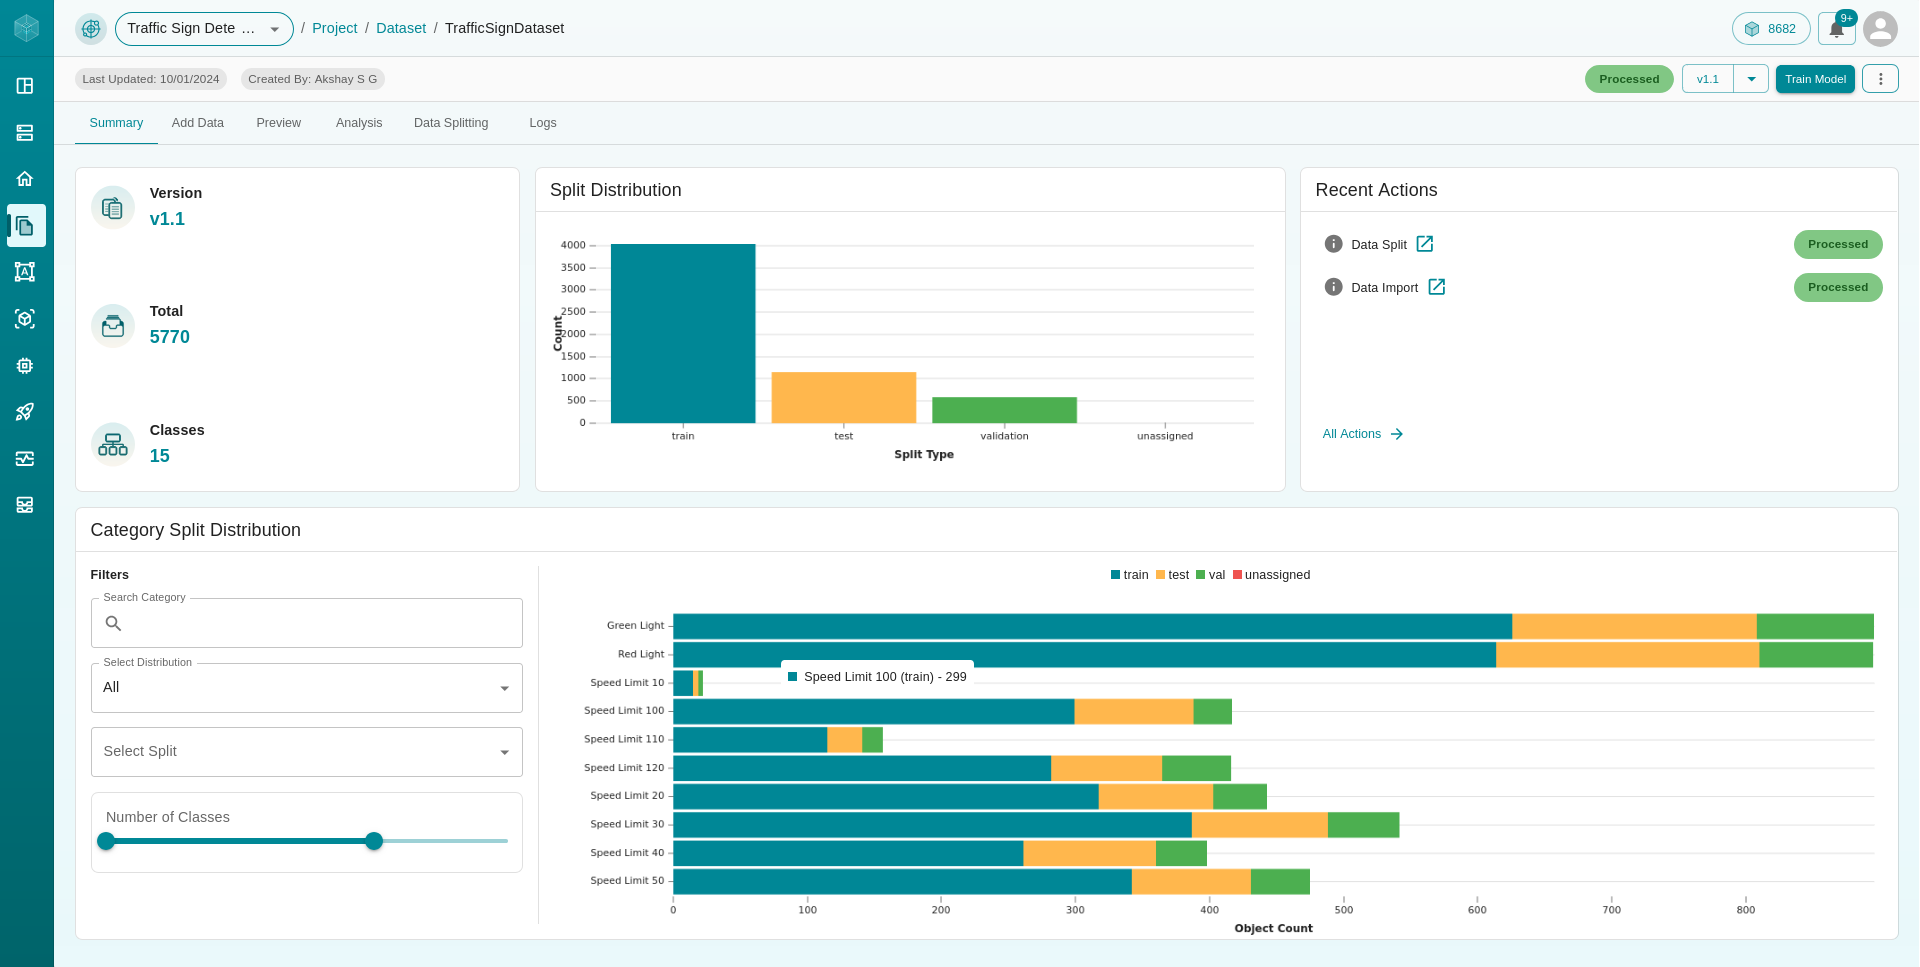
The Summary tab provides an overview of your dataset, including essential details and visualizations:
Number of Classes: See how many distinct classes are present in your dataset.
Total Number of Images: View the total image count within the dataset.
Version Details: Access information about the current dataset version.
Additionally, you can view your recent actions within the current dataset of your project. This feature provides quick insights into your latest tasks associated with your datasets, helping you keep track of changes and updates.
This tab also includes data visualizations to help you understand your dataset better:
Split Distribution: Visualize how your dataset is divided across Train, Test, Val, and Unassigned categories.
Class Distribution: Analyze the distribution of images across different classes.
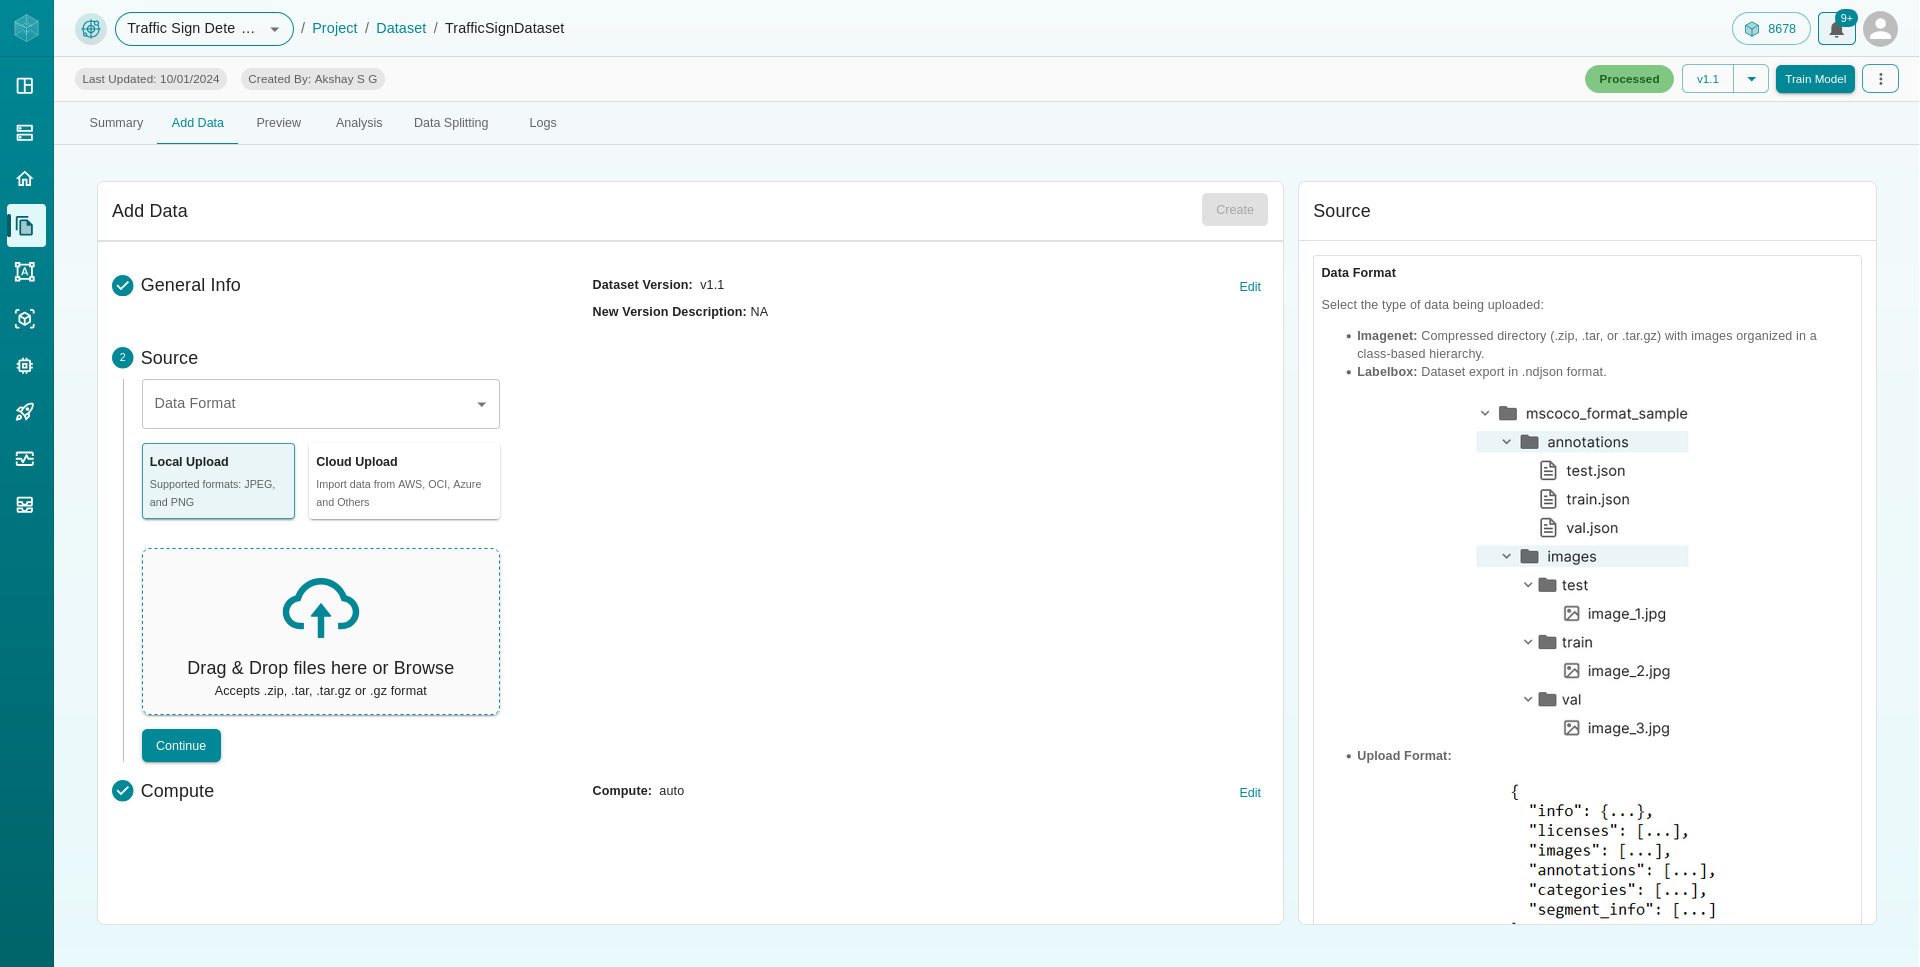
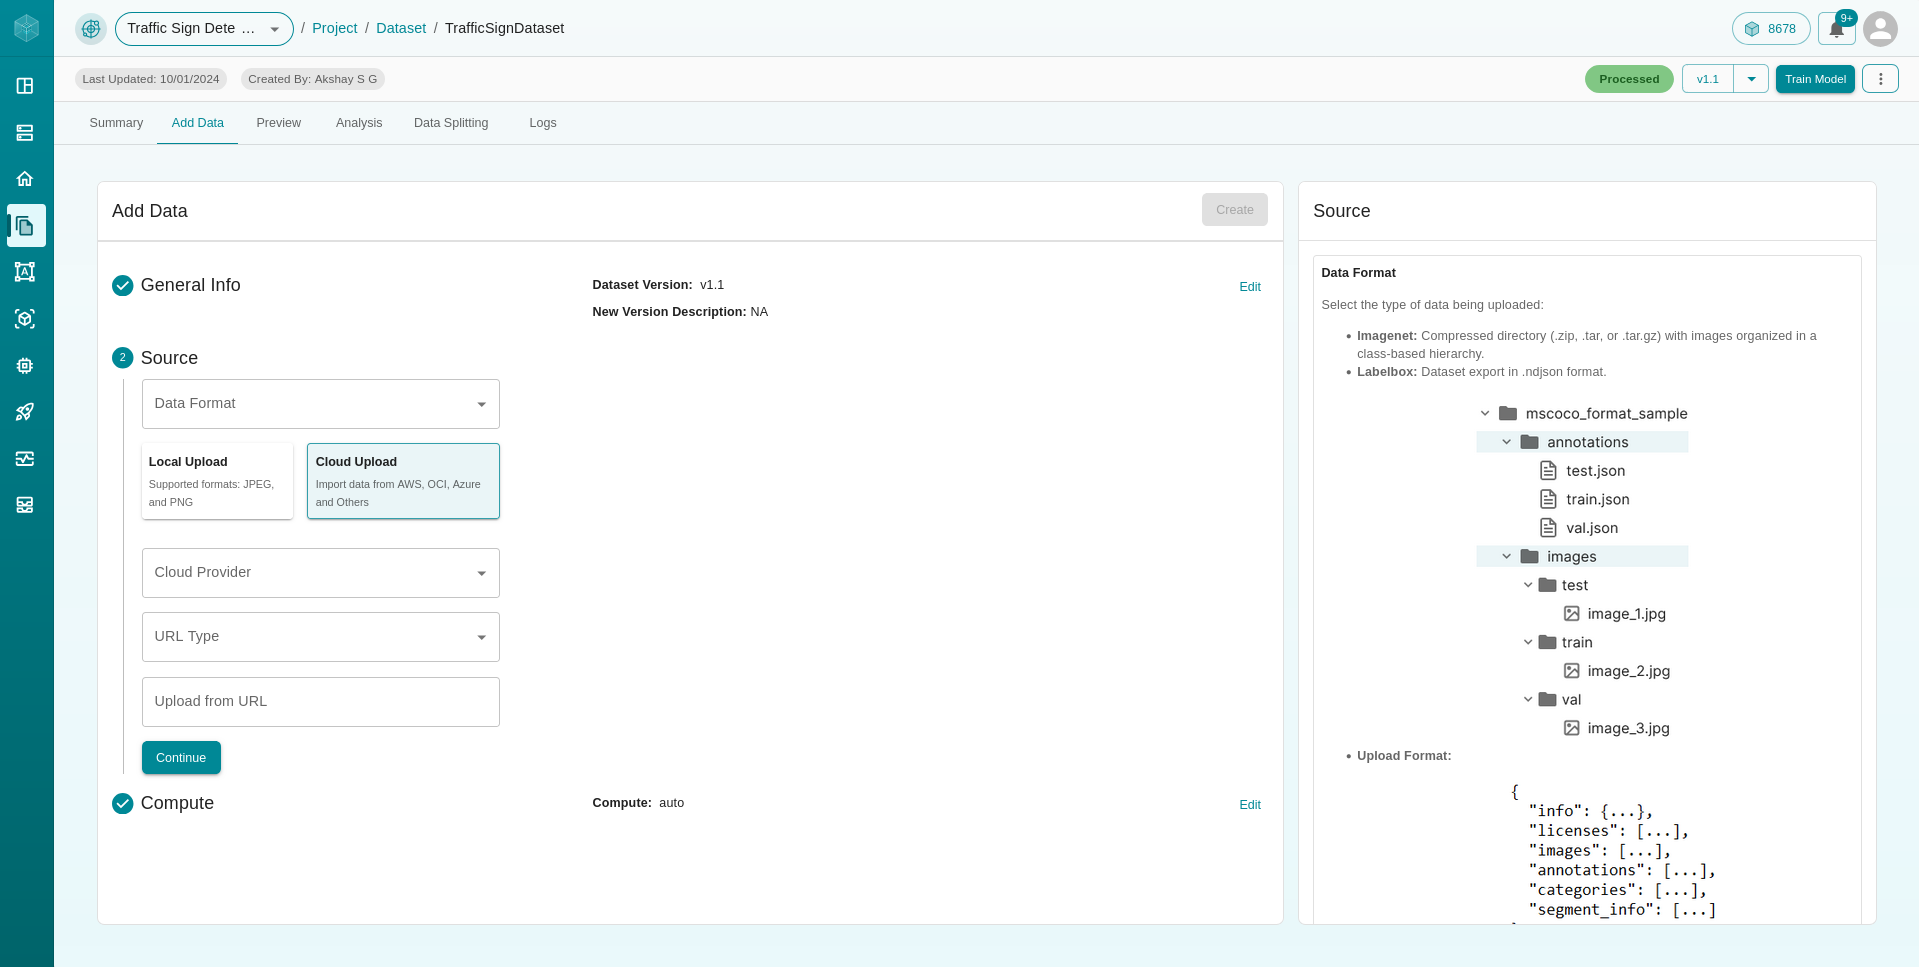
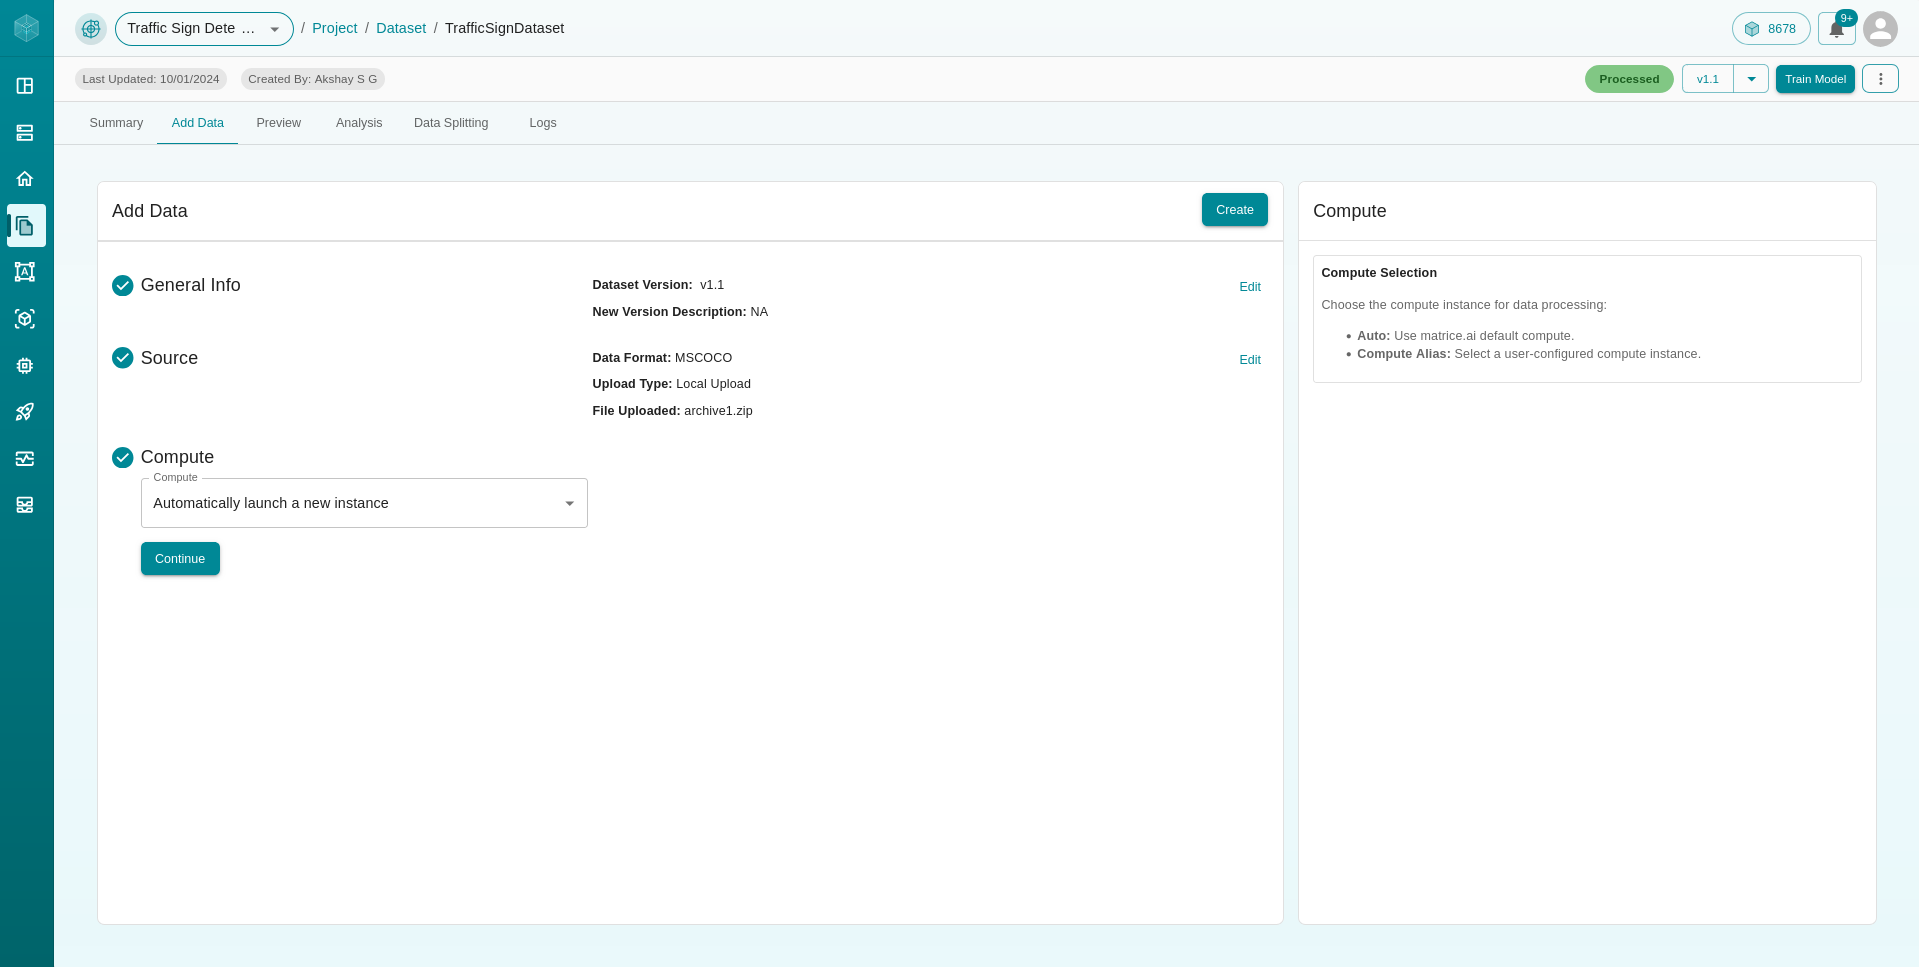
2. Add Data
The Add Data tab allows you to update your existing dataset by uploading additional images. The process follows the same steps as the initial dataset creation, whether you’re uploading from a local source or the cloud.

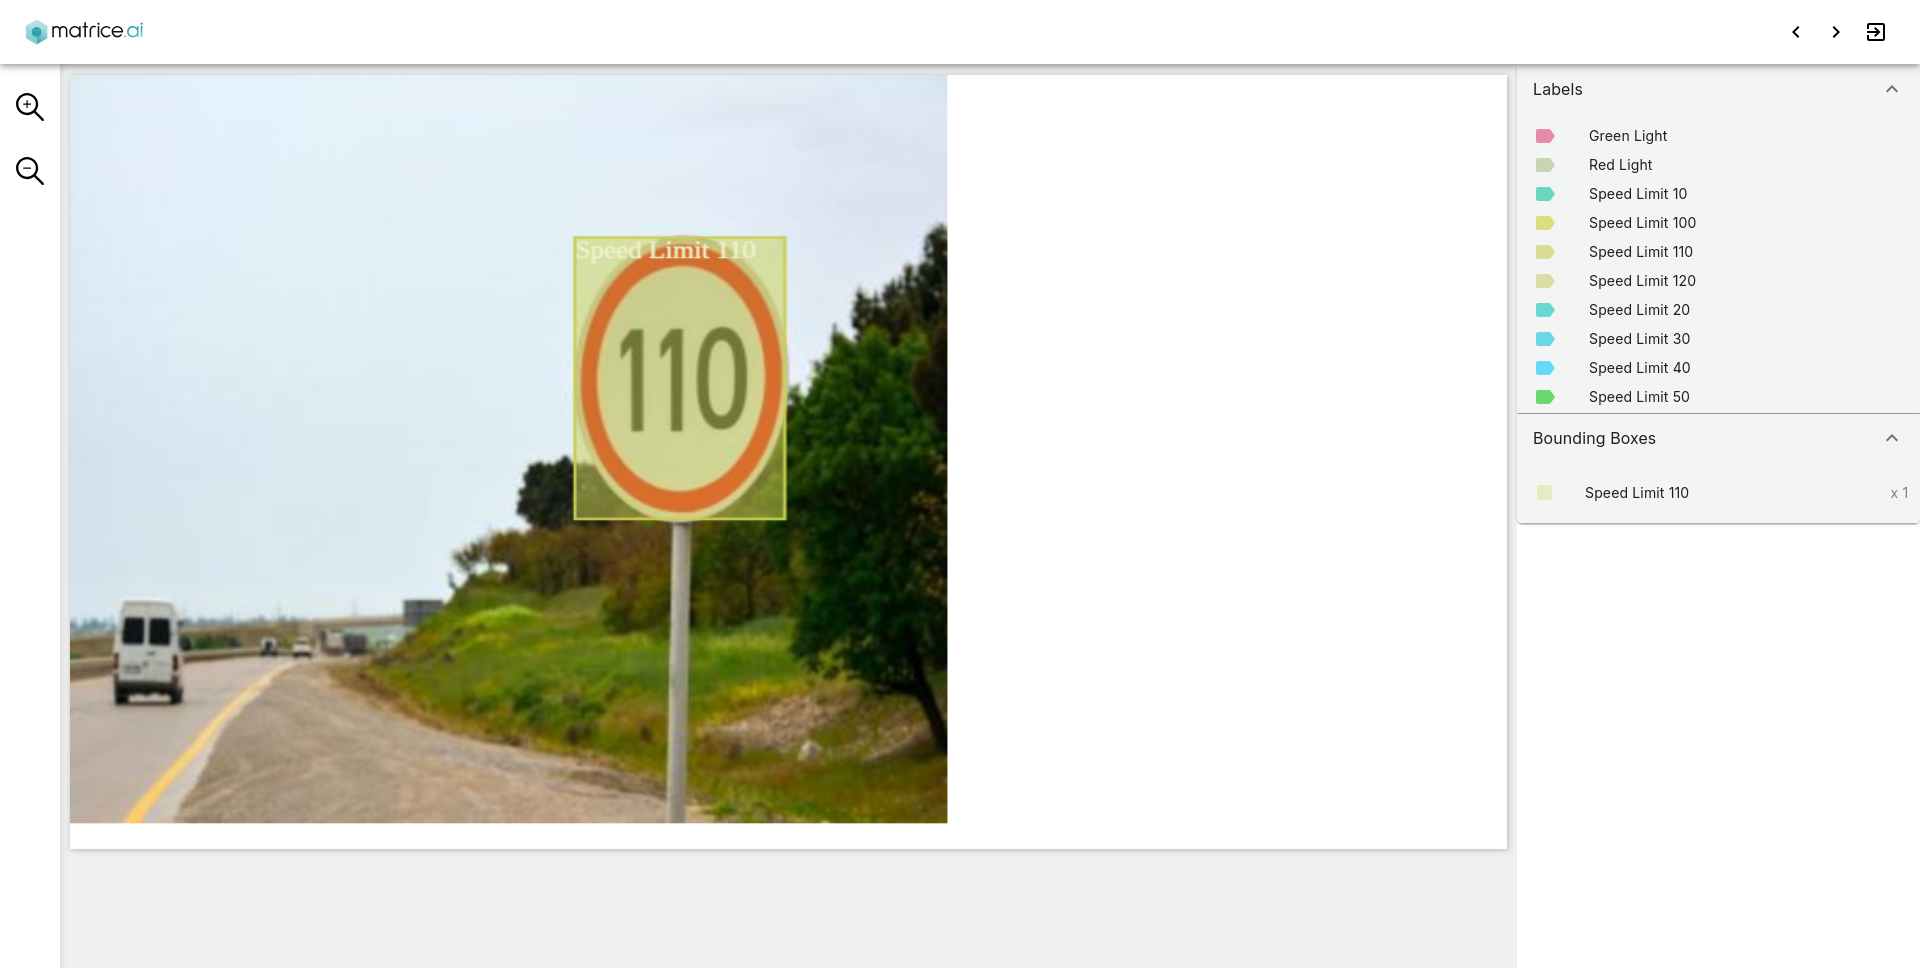
3. Preview
In the Preview tab, you can explore the processed images in your dataset. This tab allows you to inspect individual images in detail, including:
Bounding Boxes: Check the bounding boxes drawn around objects in the images.
Classification Labels: View the labels assigned to each image or object.
Segmentation Masks: Inspect the segmentation masks applied to images.
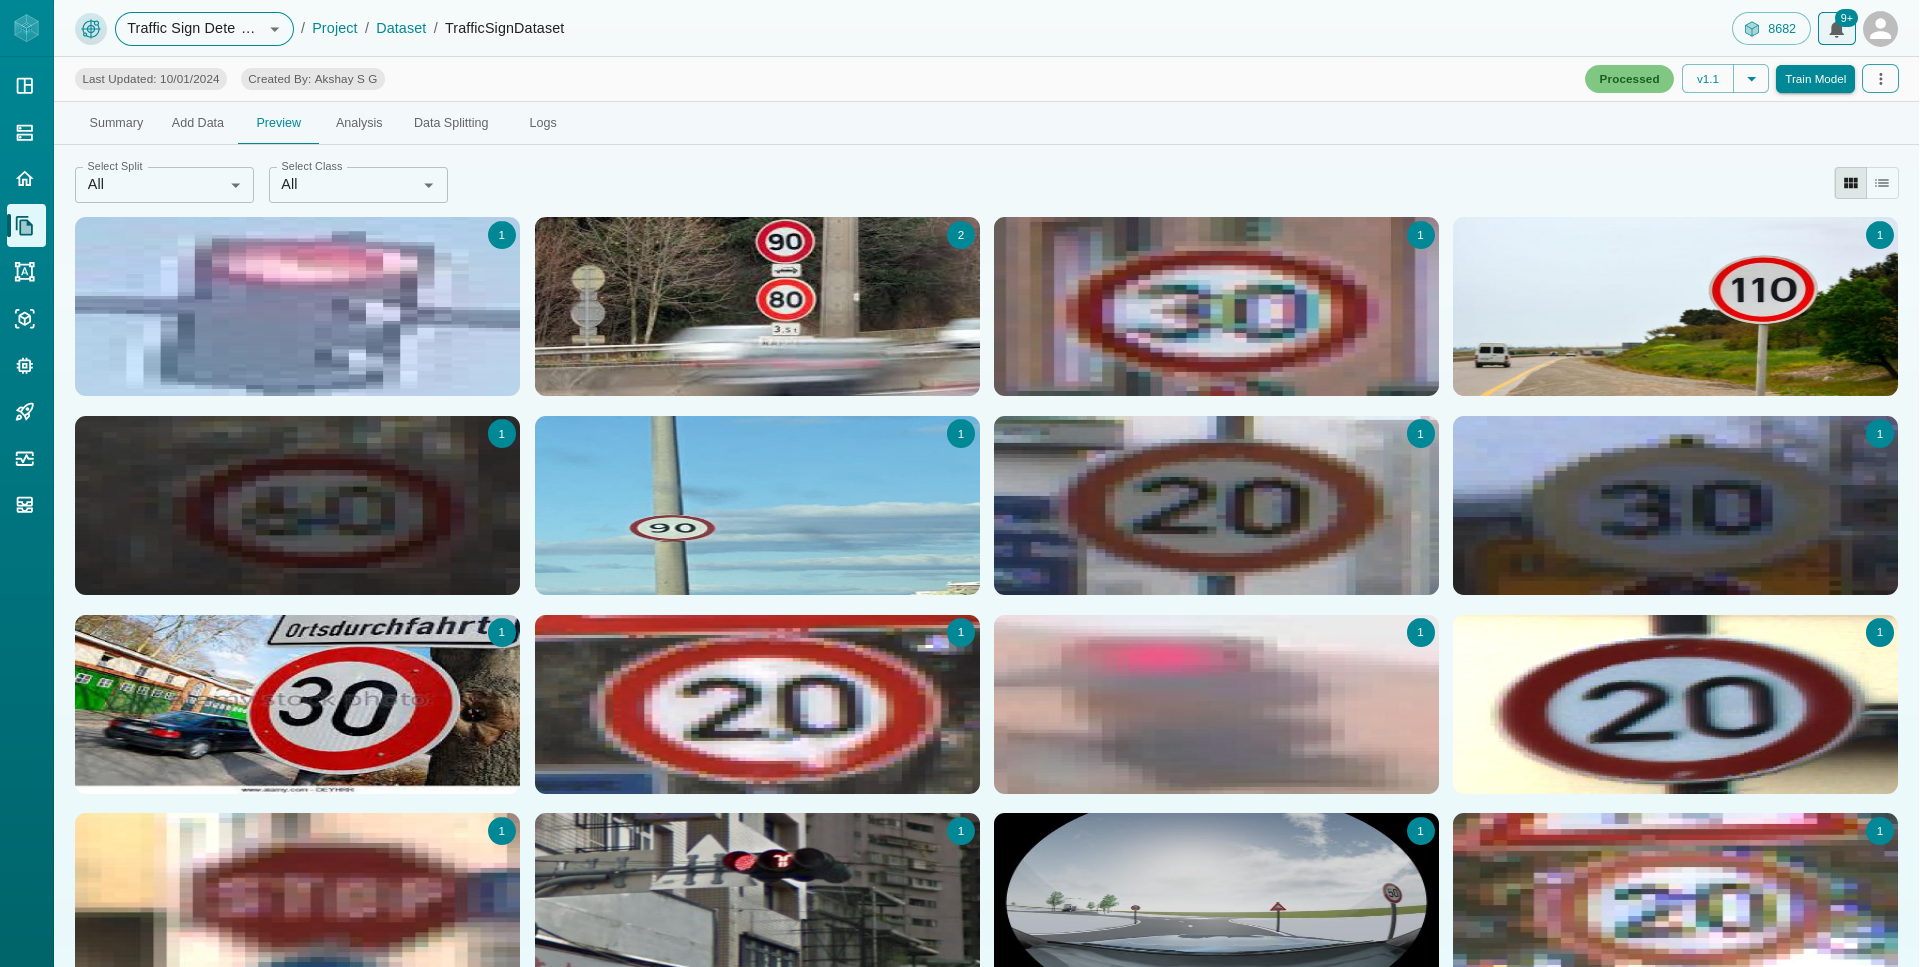
Simply click on an image for a closer, more detailed view.
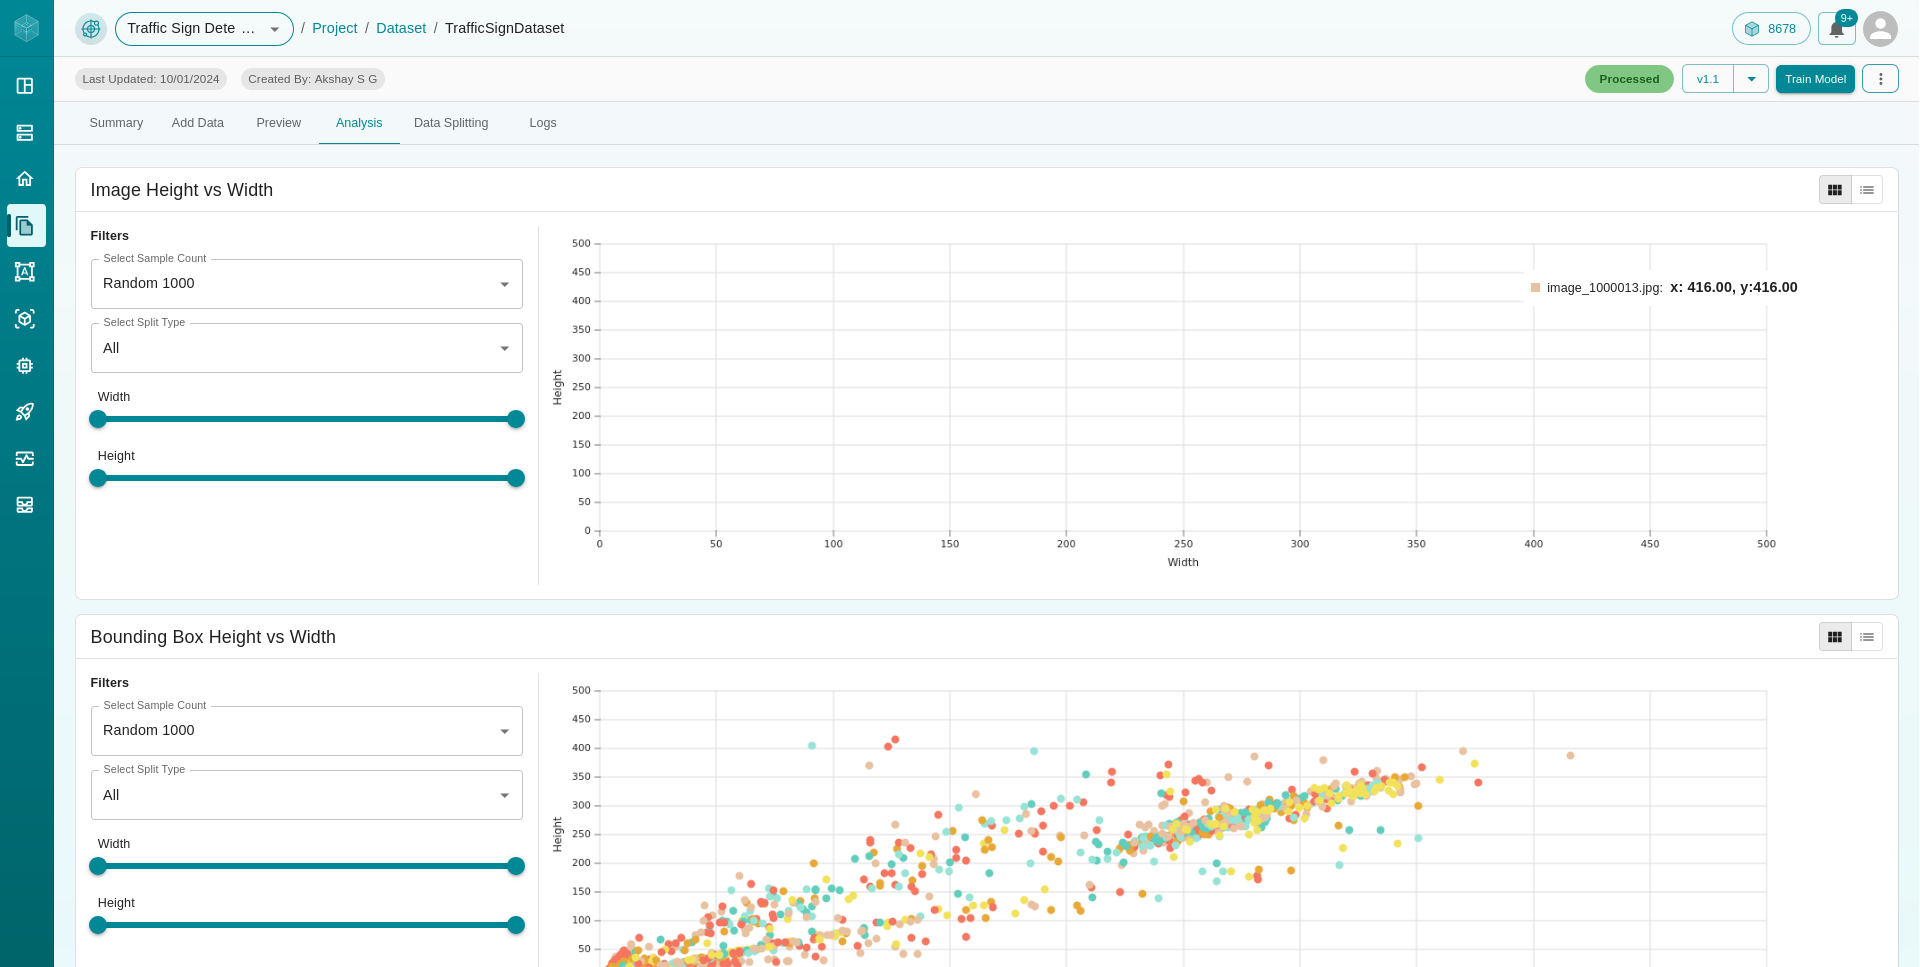
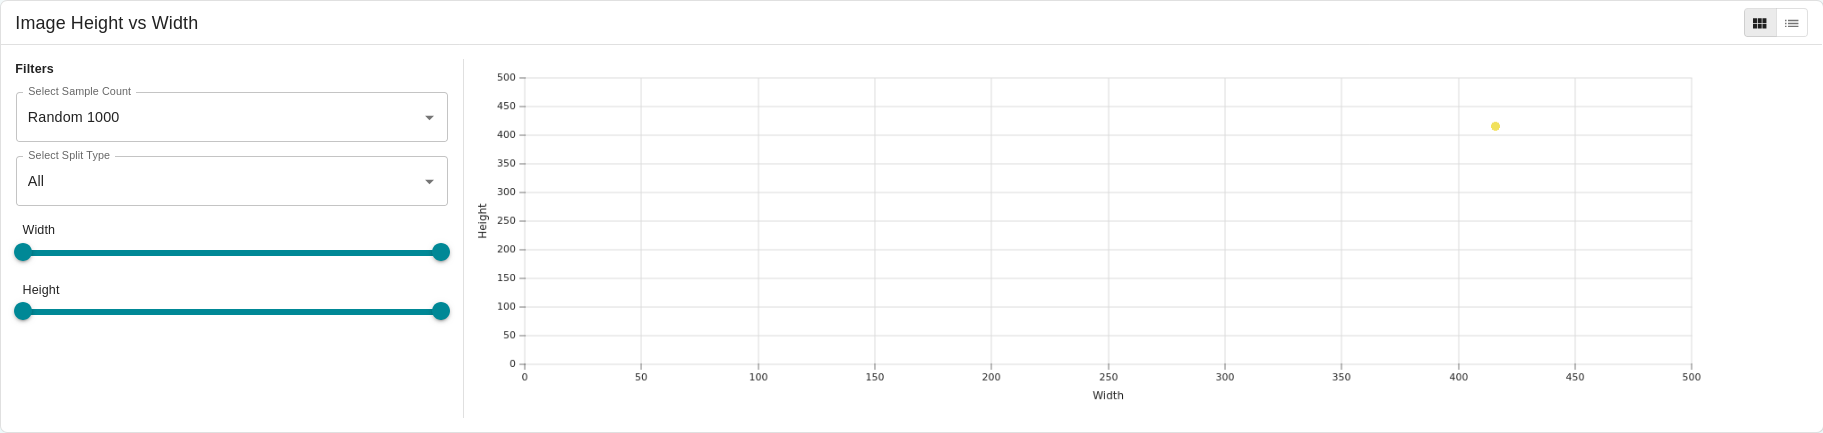
4. Analysis
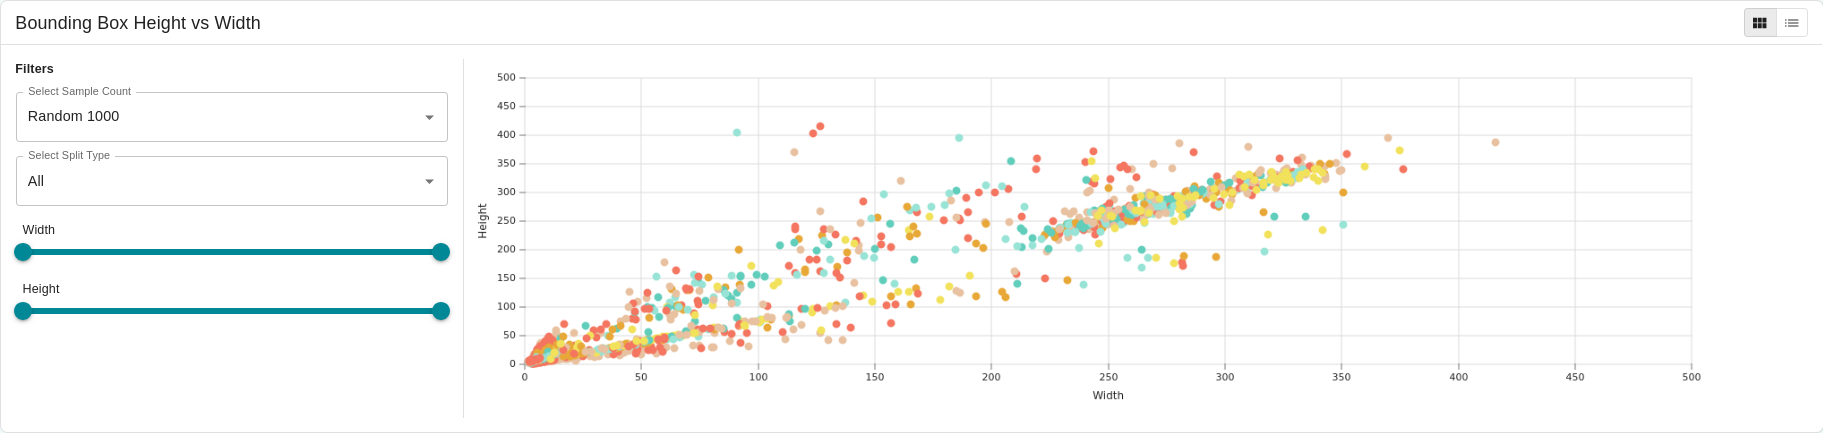
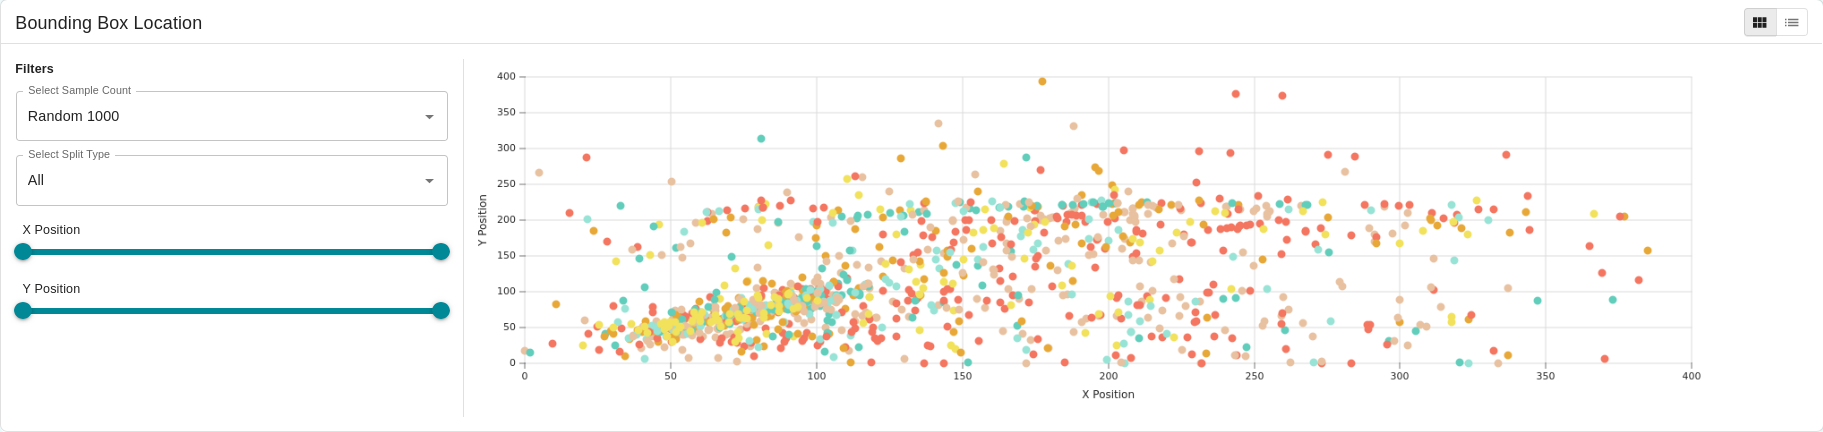
The Analysis tab provides deeper insights into your dataset through advanced visualizations:
Image Height vs Width: Analyze the dimensions of your images.
Bounding Boxes Height vs Width: Understand the size distribution of bounding boxes.
Bounding Box Location: Visualize where bounding boxes are located within the images.
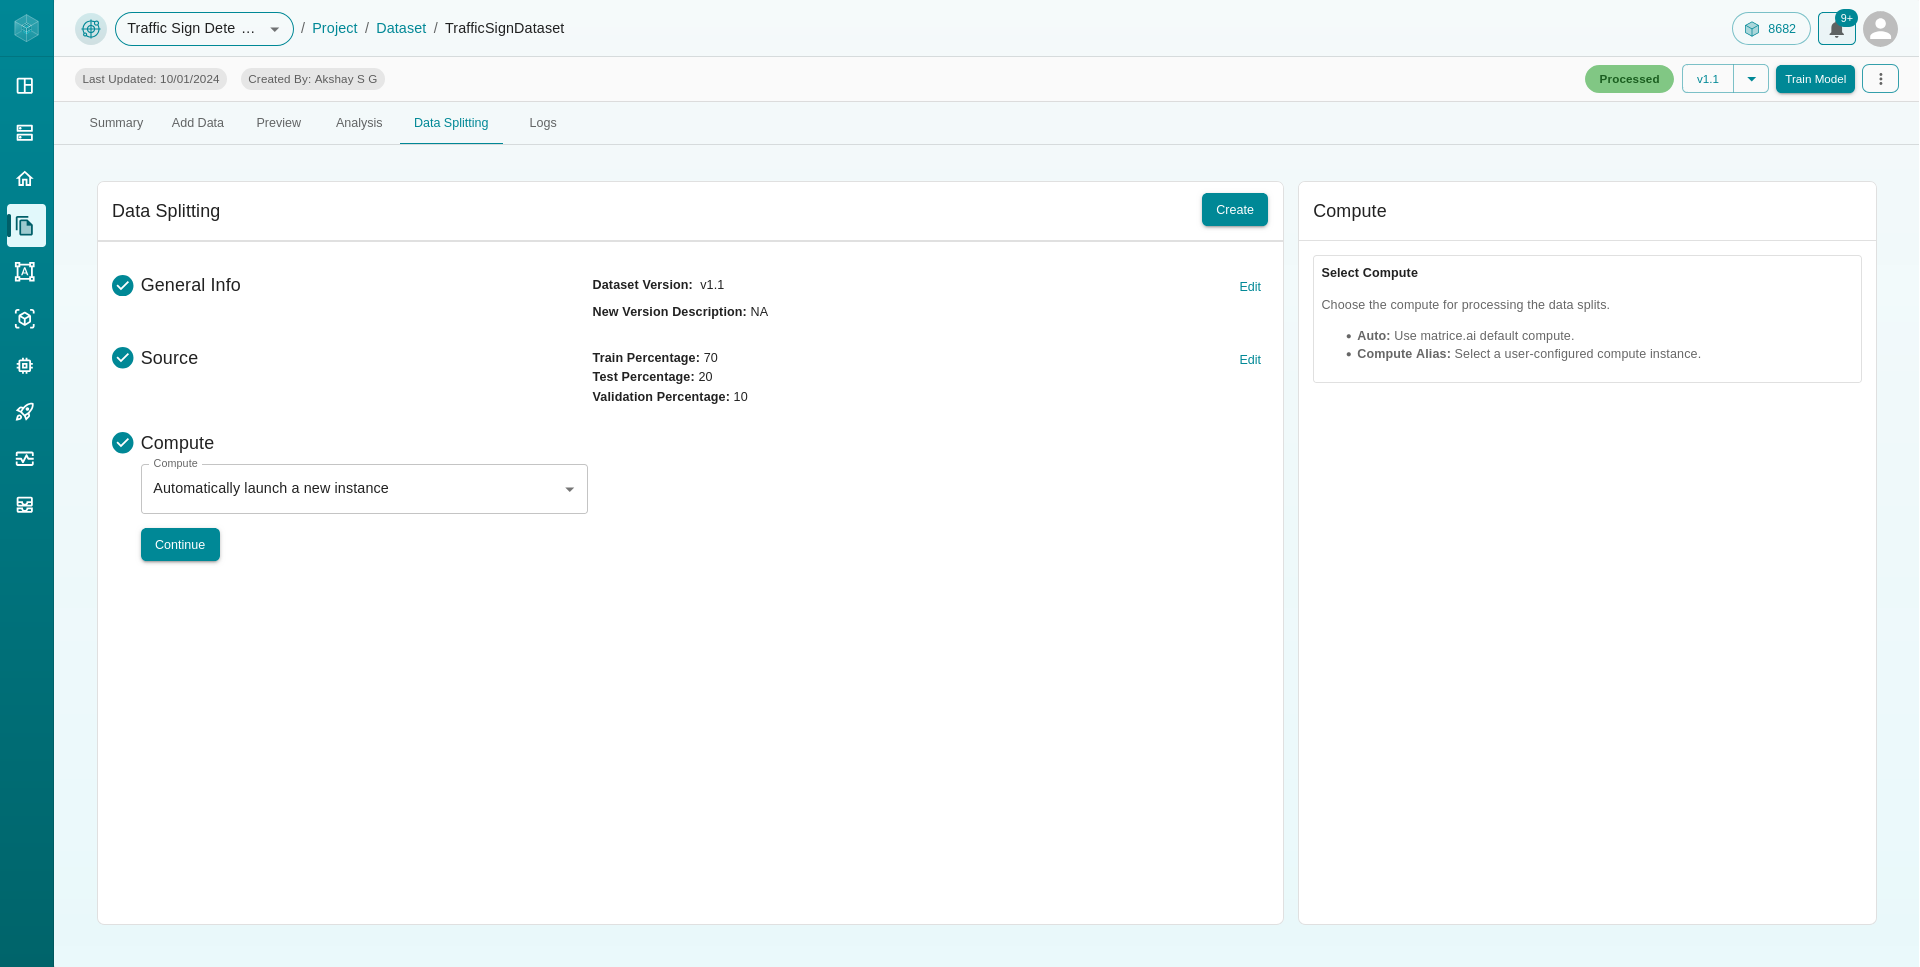
5. Data Splitting
The Data Splitting tab offers two methods to split your dataset into Train, Test, Val, and Unassigned folders after processing:
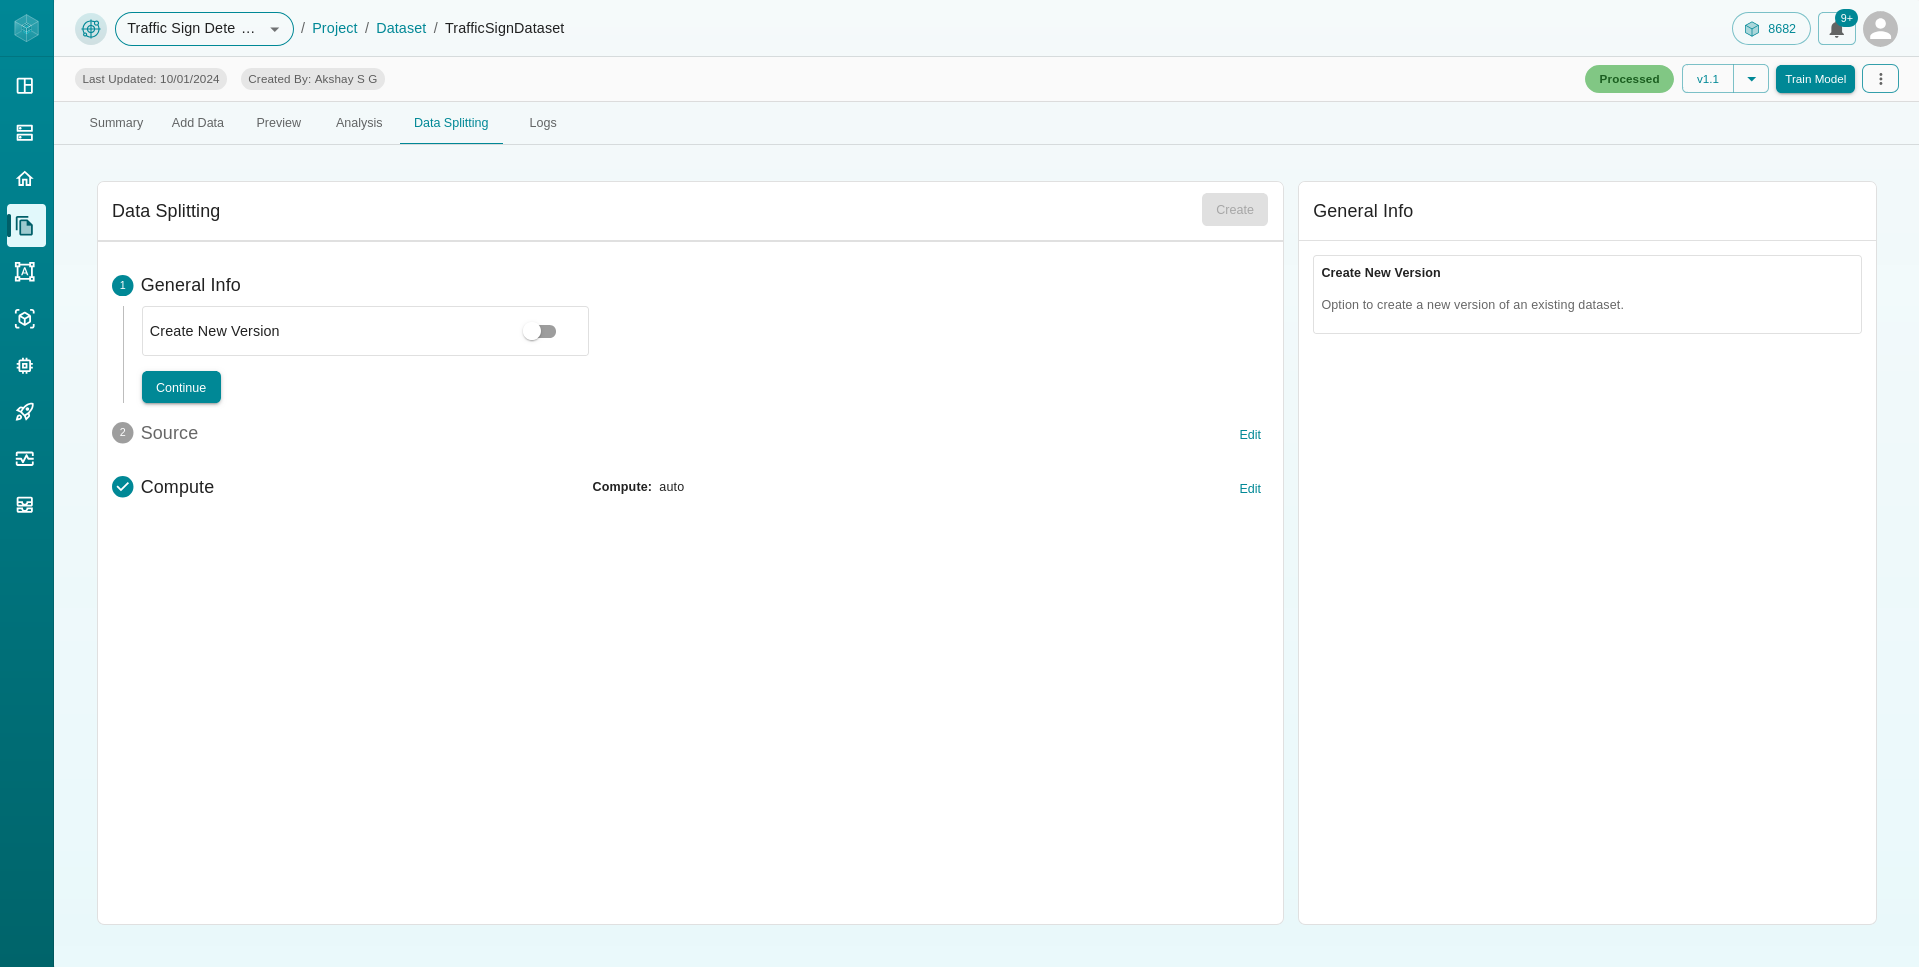
New Random Splits: Specify the desired percentage for each split (e.g., Train, Test, Val), and the dataset will be randomly divided according to your inputs.
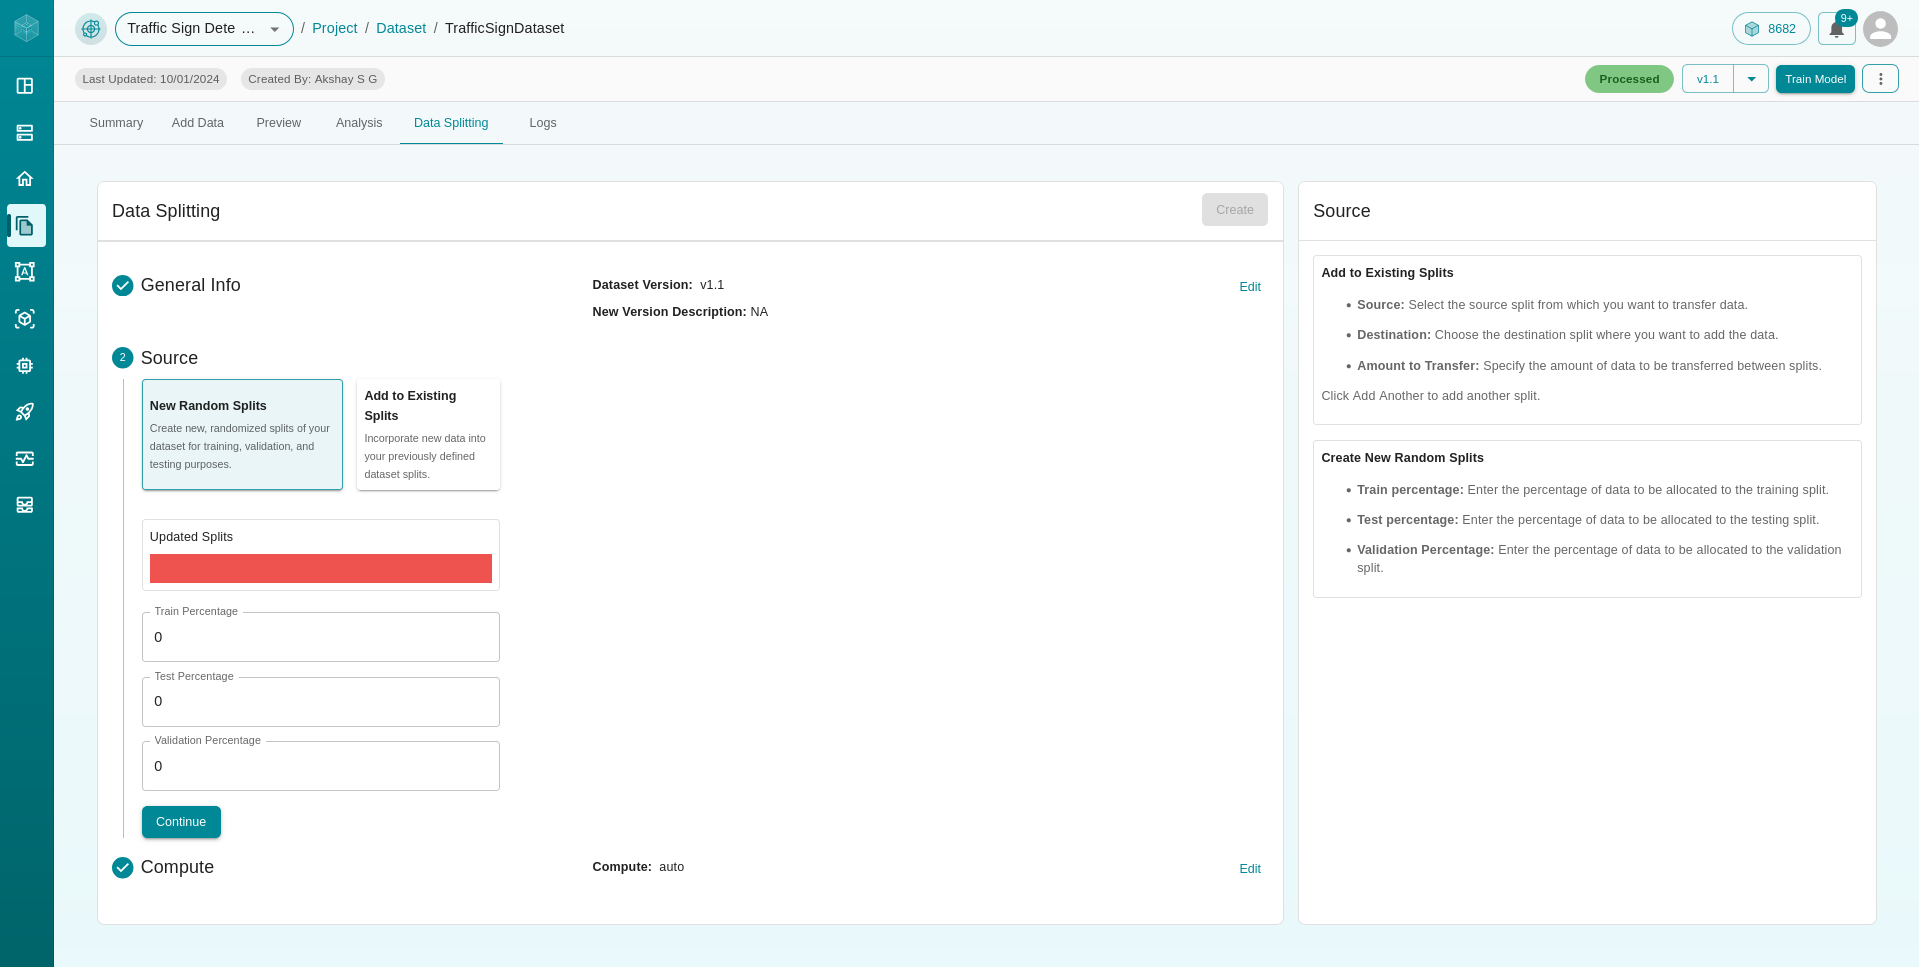
Add to Existing Splits: Instead of random splitting, you can manually move a specific number of images from one split to another (e.g., transferring 500 images from the Train split to the Test split).
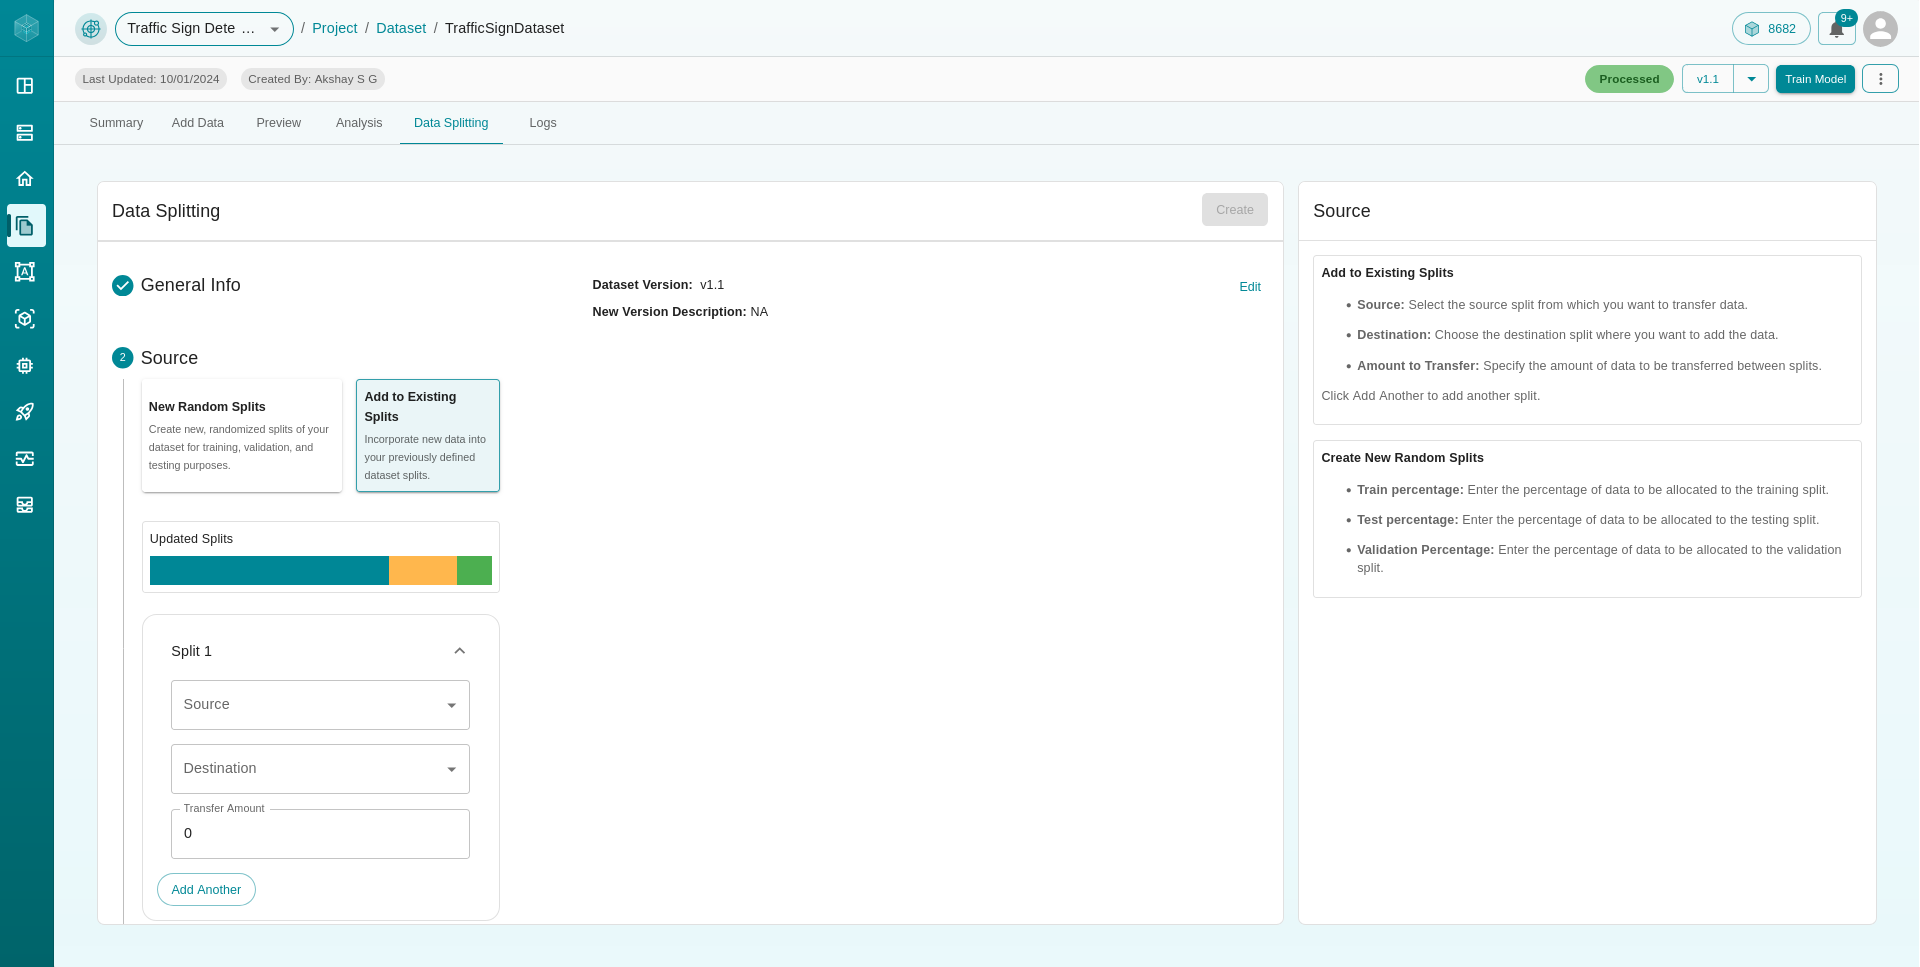
After selecting the split, choose the compute resource to launch the data split process.
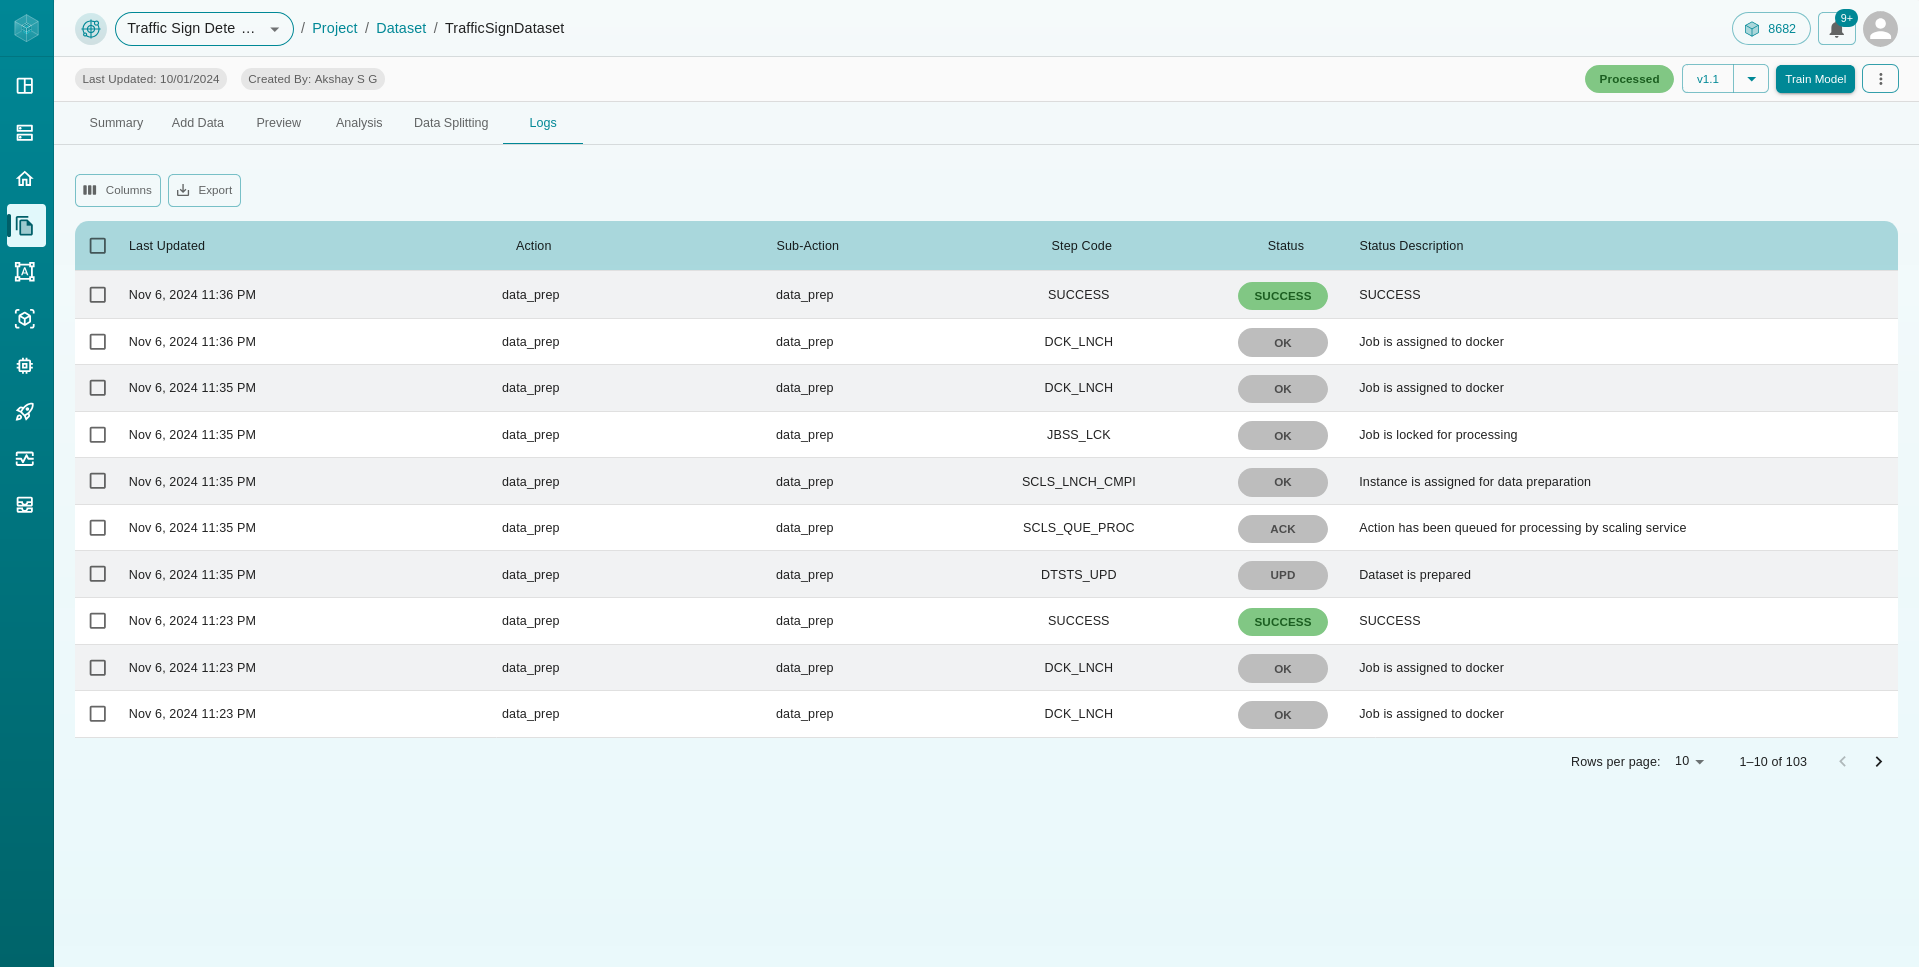
6. Logs
The Logs tab keeps track of all actions and operations performed on your dataset. This log provides valuable insights and details about the dataset’s processing history, helping you understand what changes have been made over time.
By utilizing these management features, you can ensure that your dataset is perfectly tailored to your project’s needs, giving you the flexibility and control required for successful machine learning workflows.