Drift Monitoring Overview
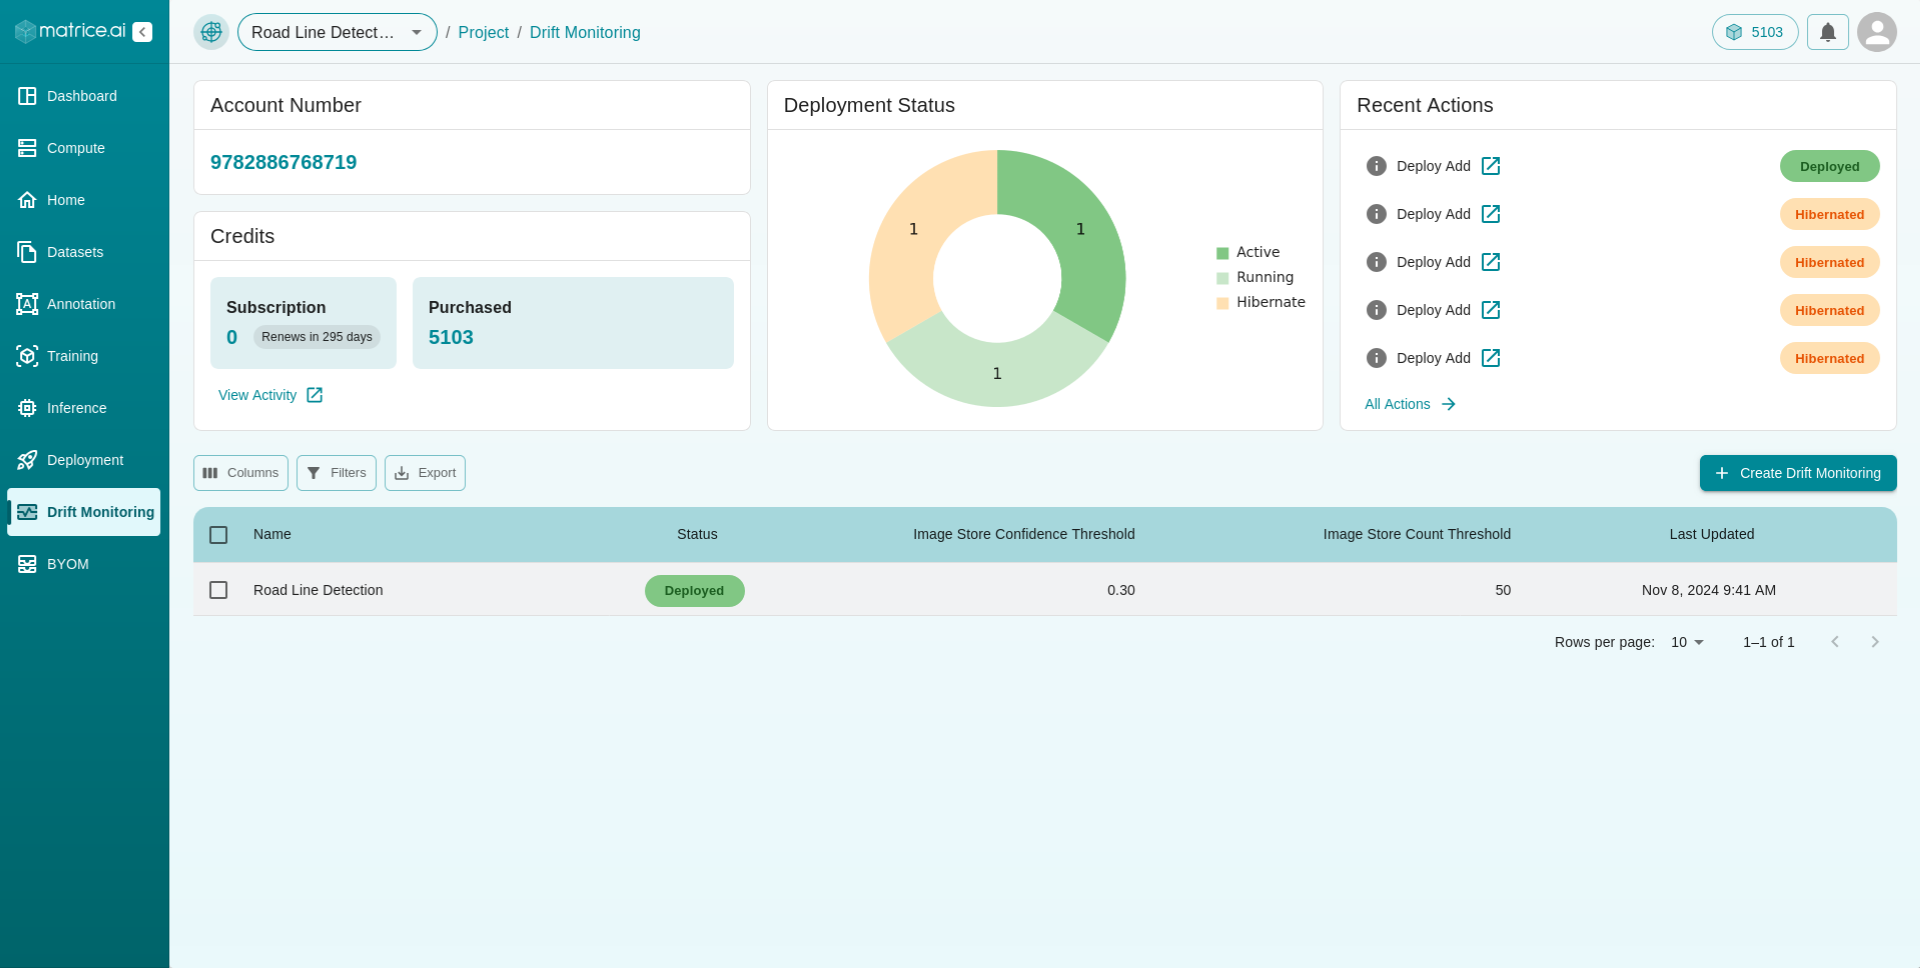
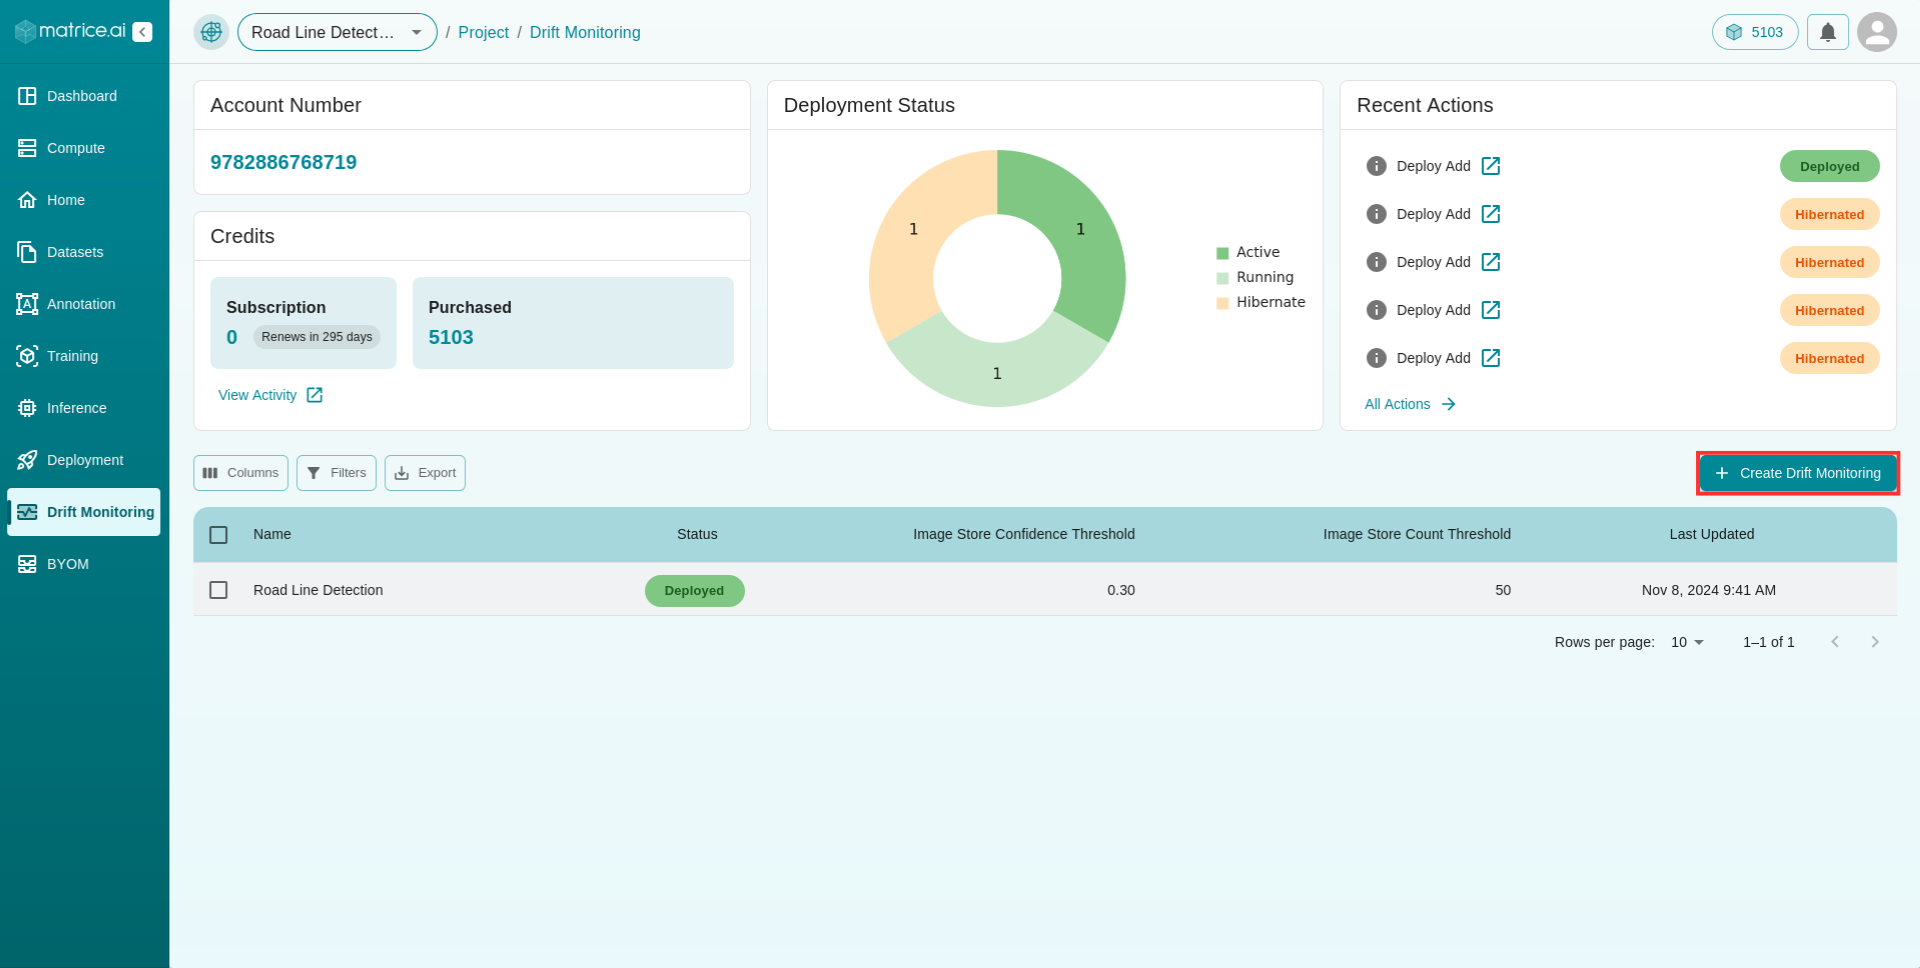
The Drift Monitoring feature on the Matrice platform allows users to monitor the performance of their deployed models over time. Within the Drift Monitoring dashboard, users can view details such as their account credits, deployment status, and a log of recent activities related to drift monitoring. A key element of the dashboard is a table that displays all drift monitoring activities, providing essential information like:
Name: The identifier of the drift monitor.
Status: The current operational status of the drift monitor.
Image Confidence Threshold: The confidence score required for an image to be considered during drift monitoring.
Image Store Count Threshold: The minimum number of images needed before storing is triggered.
Last Updated: The most recent update timestamp for the drift monitor.
Creating a Drift Monitor
To create a new drift monitor, follow these steps:
Click on the “+Create Drift Monitoring” button located at the top-right corner of the drift monitoring table on the dashboard. This action will redirect you to a form page where you can set up the drift monitor.
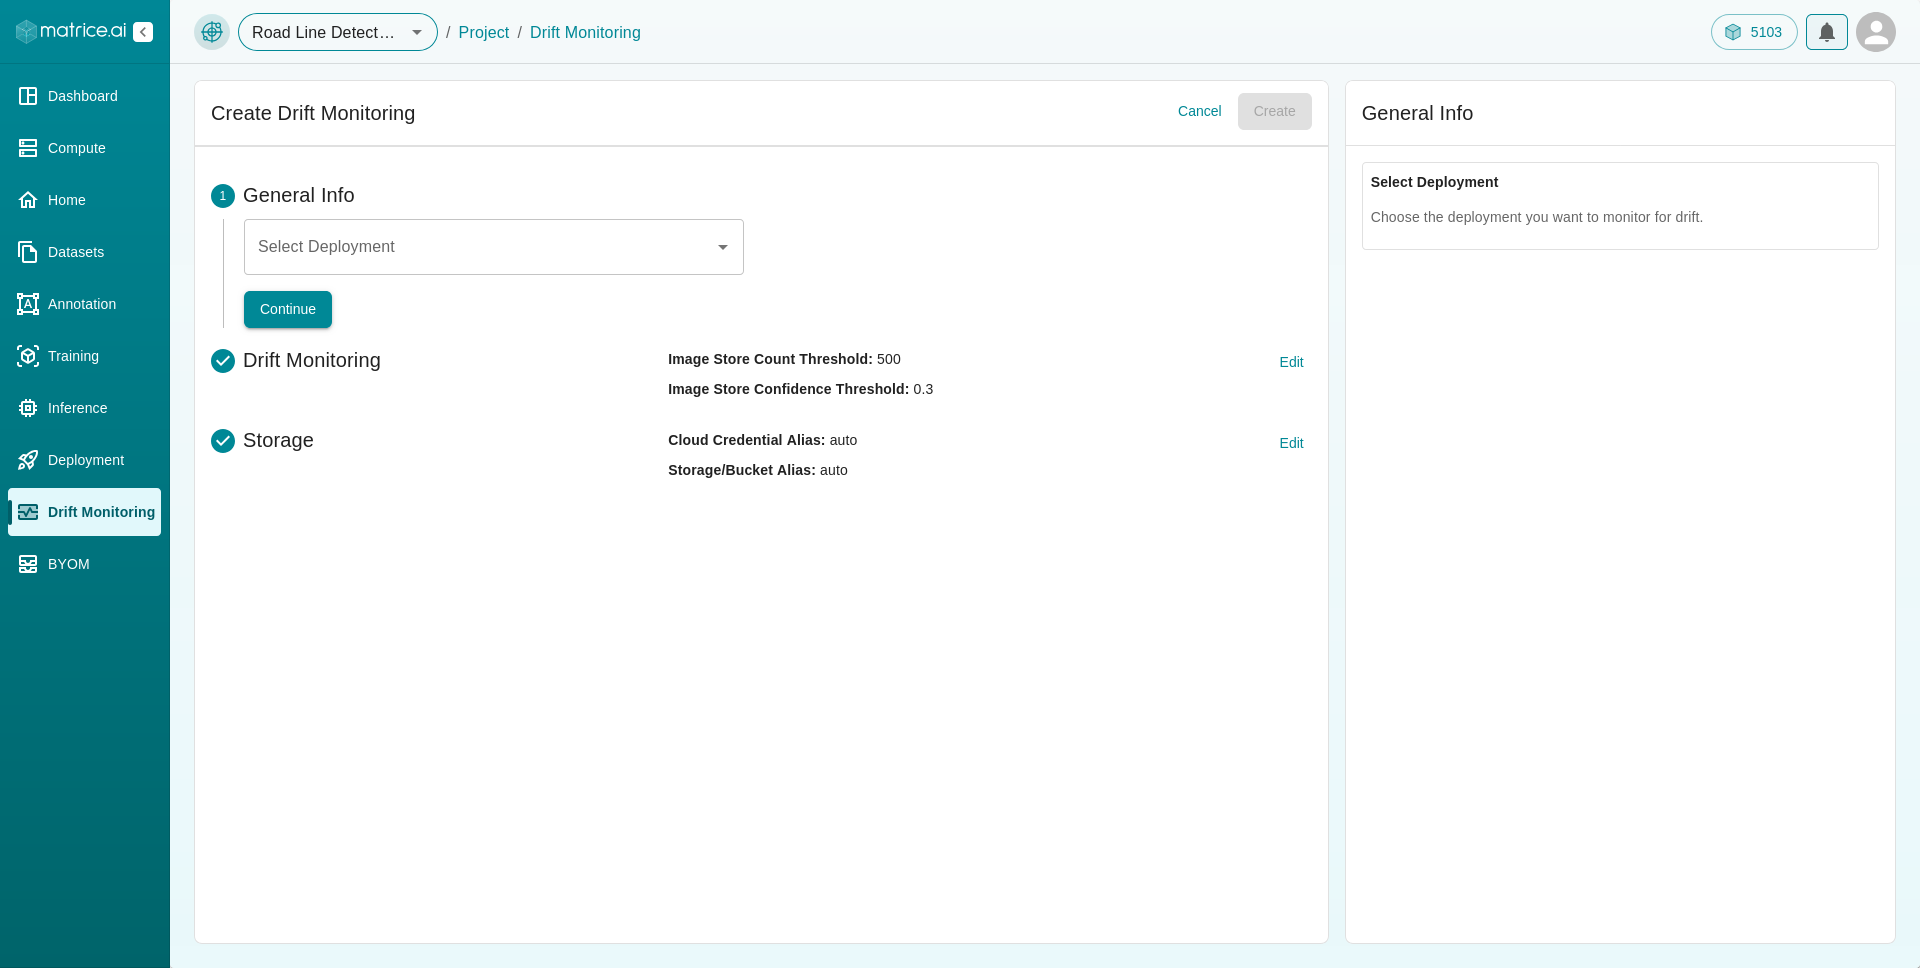
Fill in the form with the following details:
General Info: Select the name of the deployment that you want to monitor.
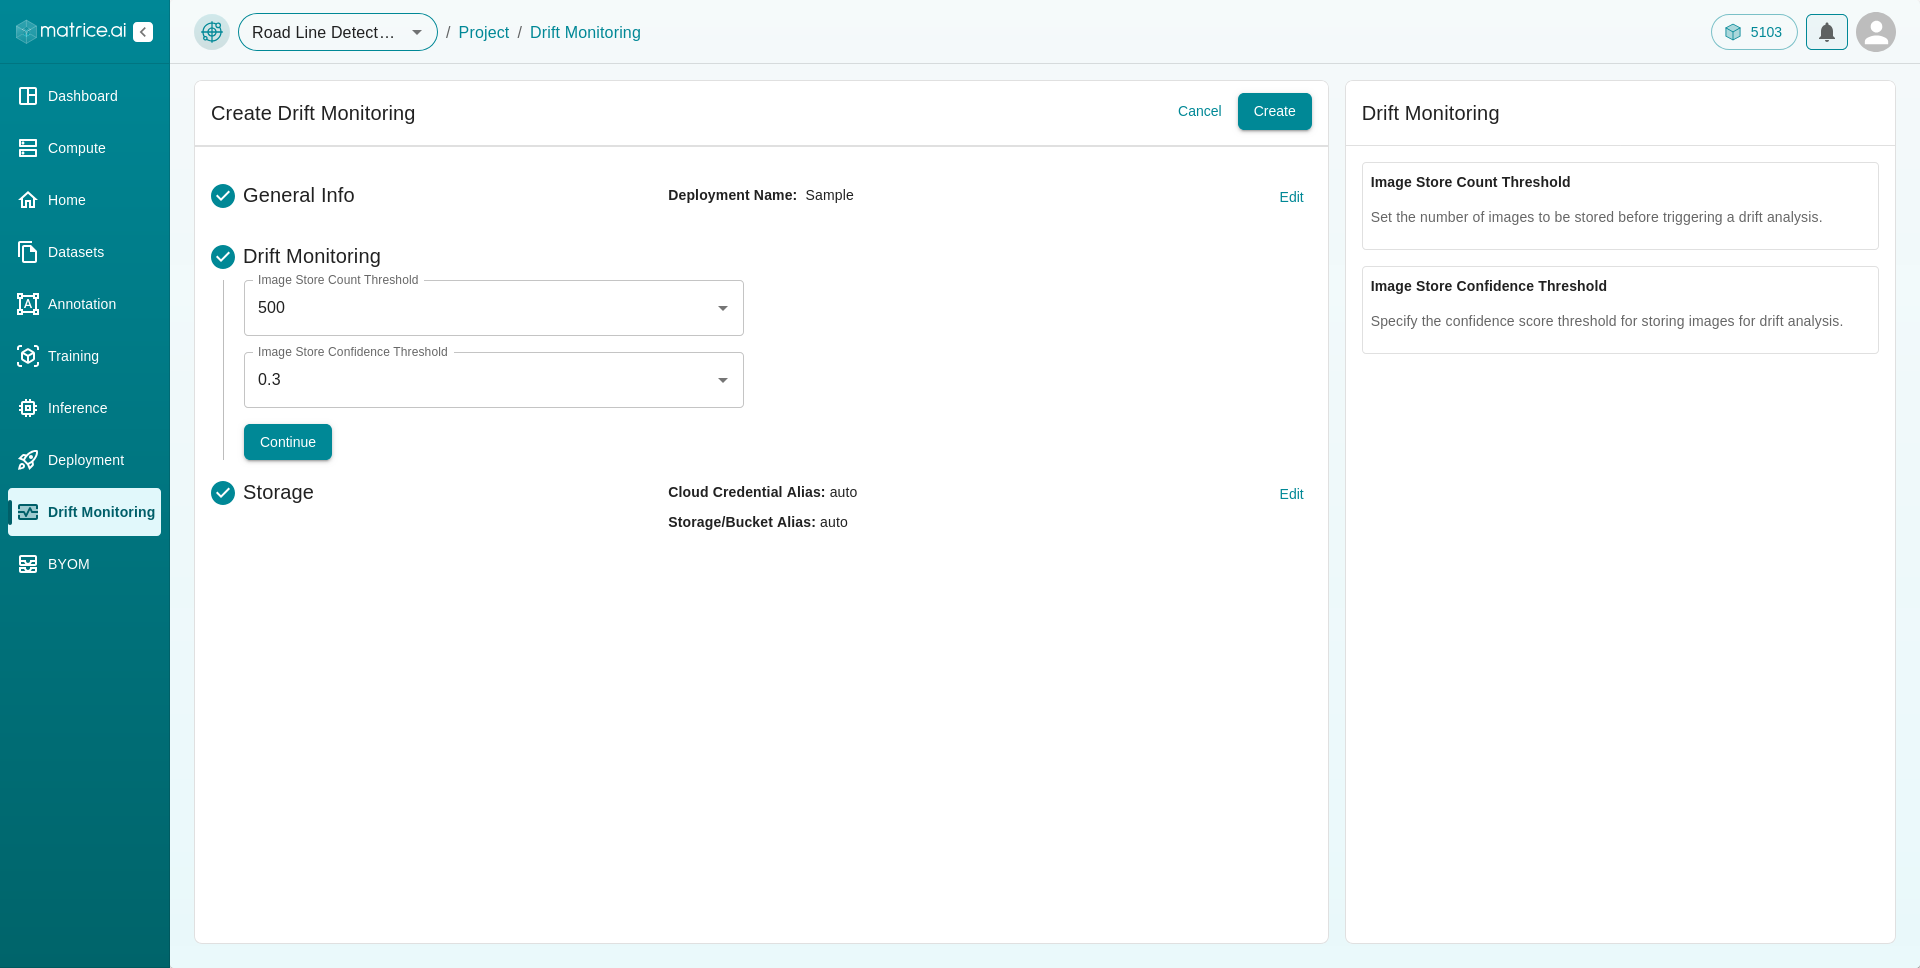
Drift Monitoring Parameters: Set the Image Store Count Threshold and Image Store Confidence Threshold (both values should be between 0 and 1).
Storage: Choose between private and public storage for your data:
Public Storage: Your data will be stored on Matrice’s server along with other datasets.
Private Storage: Your dataset will be kept private. You must provide the cloud credential alias and storage bucket alias to store the files on your own cloud.
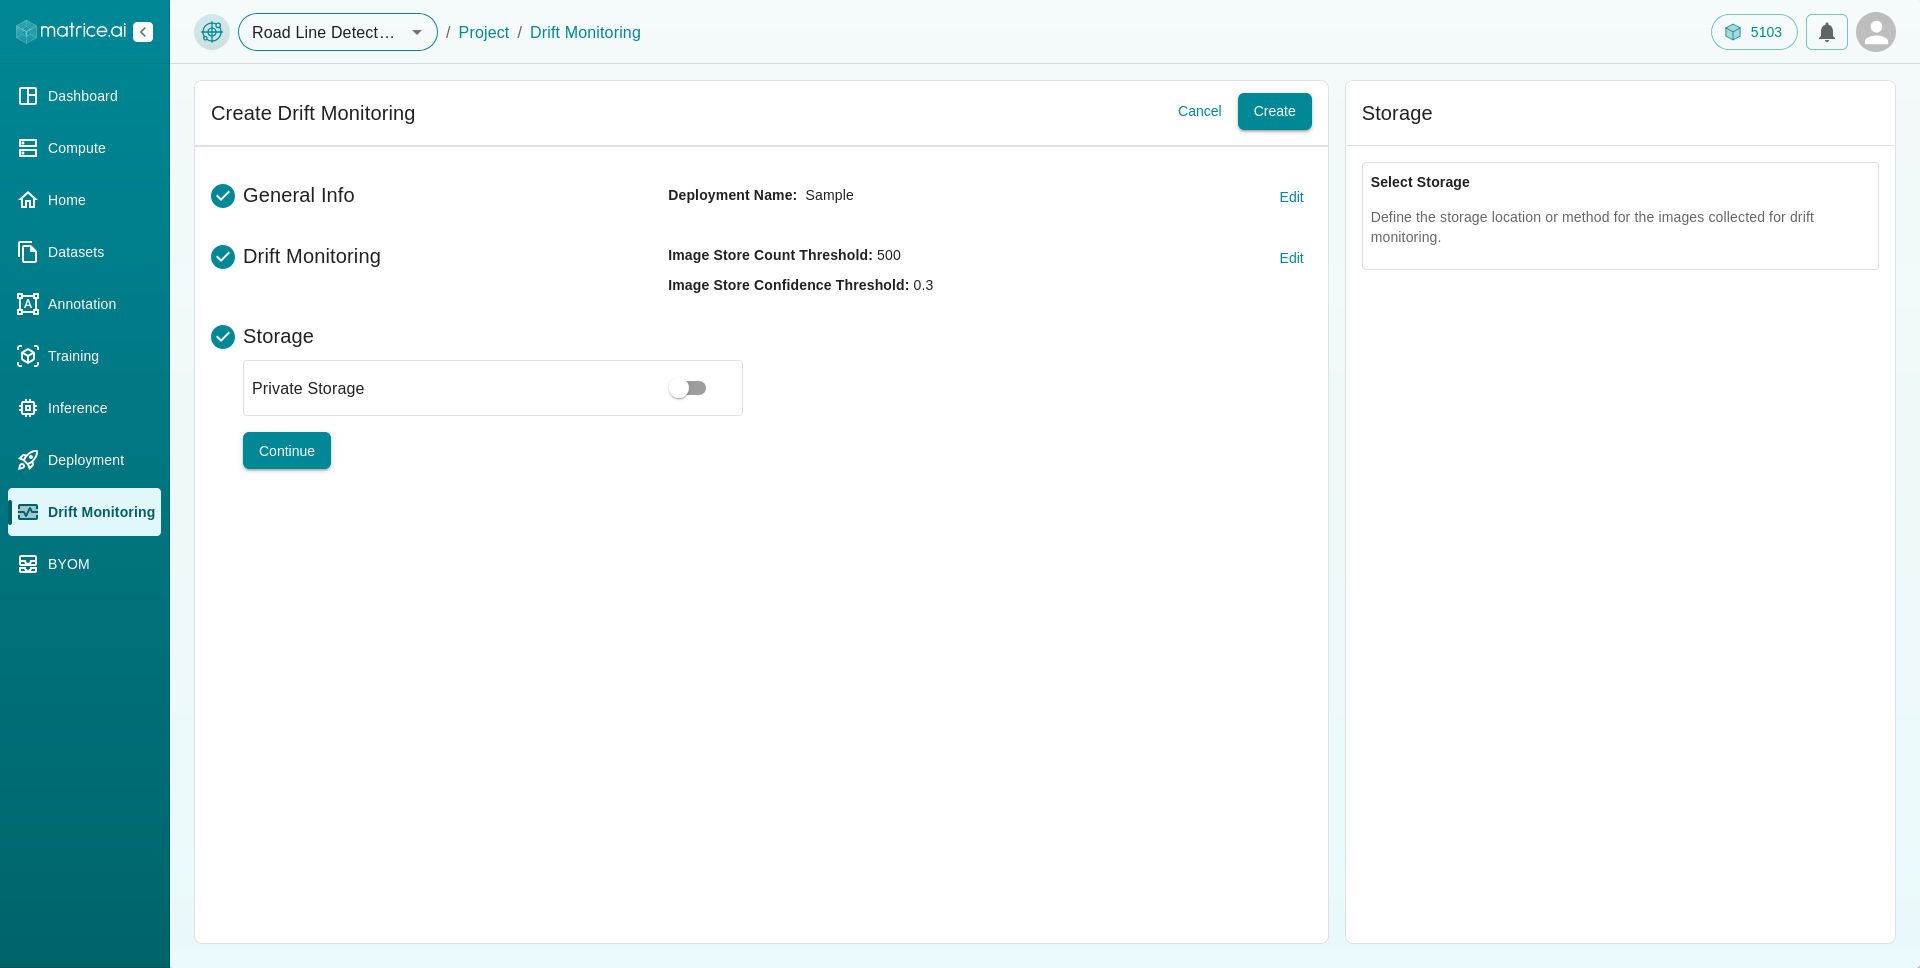
Click “Create” to complete the setup of the drift monitor.
Managing a Drift Monitor
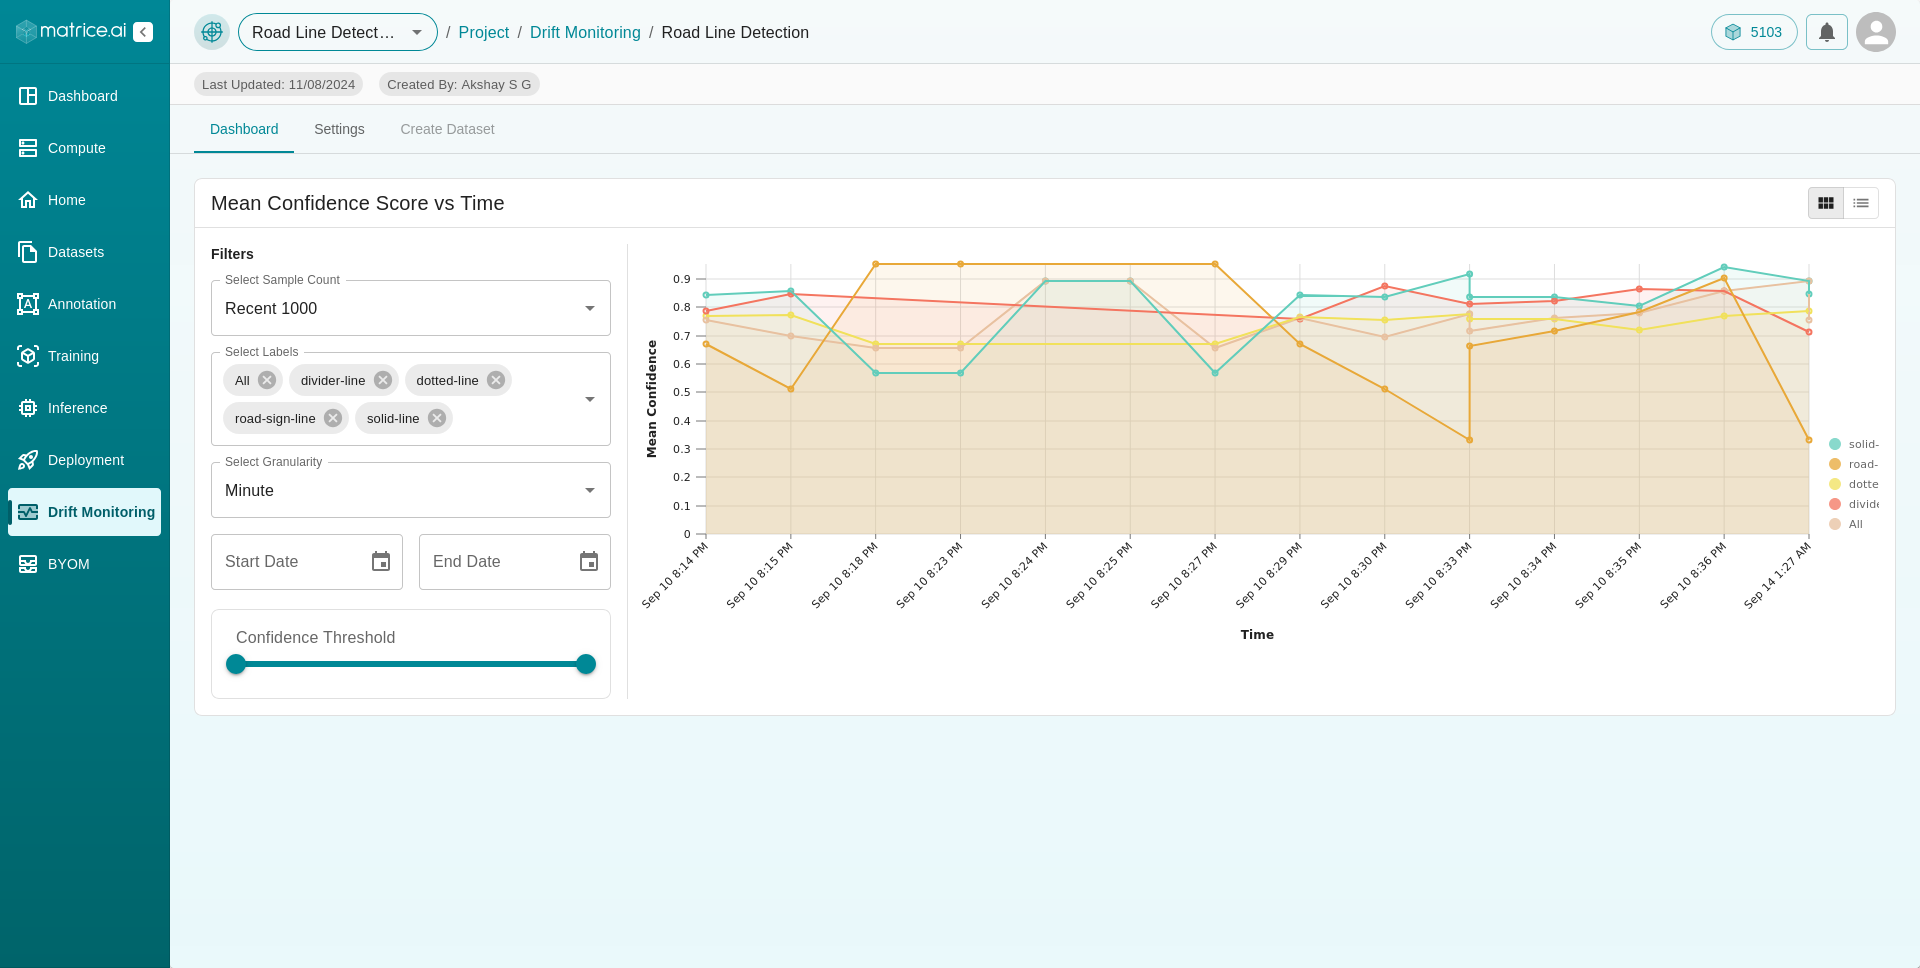
Once a drift monitor has been created, you can manage it by clicking on its name in the drift monitoring table on the dashboard. This will bring you to a dedicated dashboard for the selected drift monitor, which includes three tabs:
Drift Monitor: This tab features a “Mean Confidence Score vs Time” graph, which gets updated every time the deployed model is used to make a prediction. This visualization helps track how the confidence scores change over time.
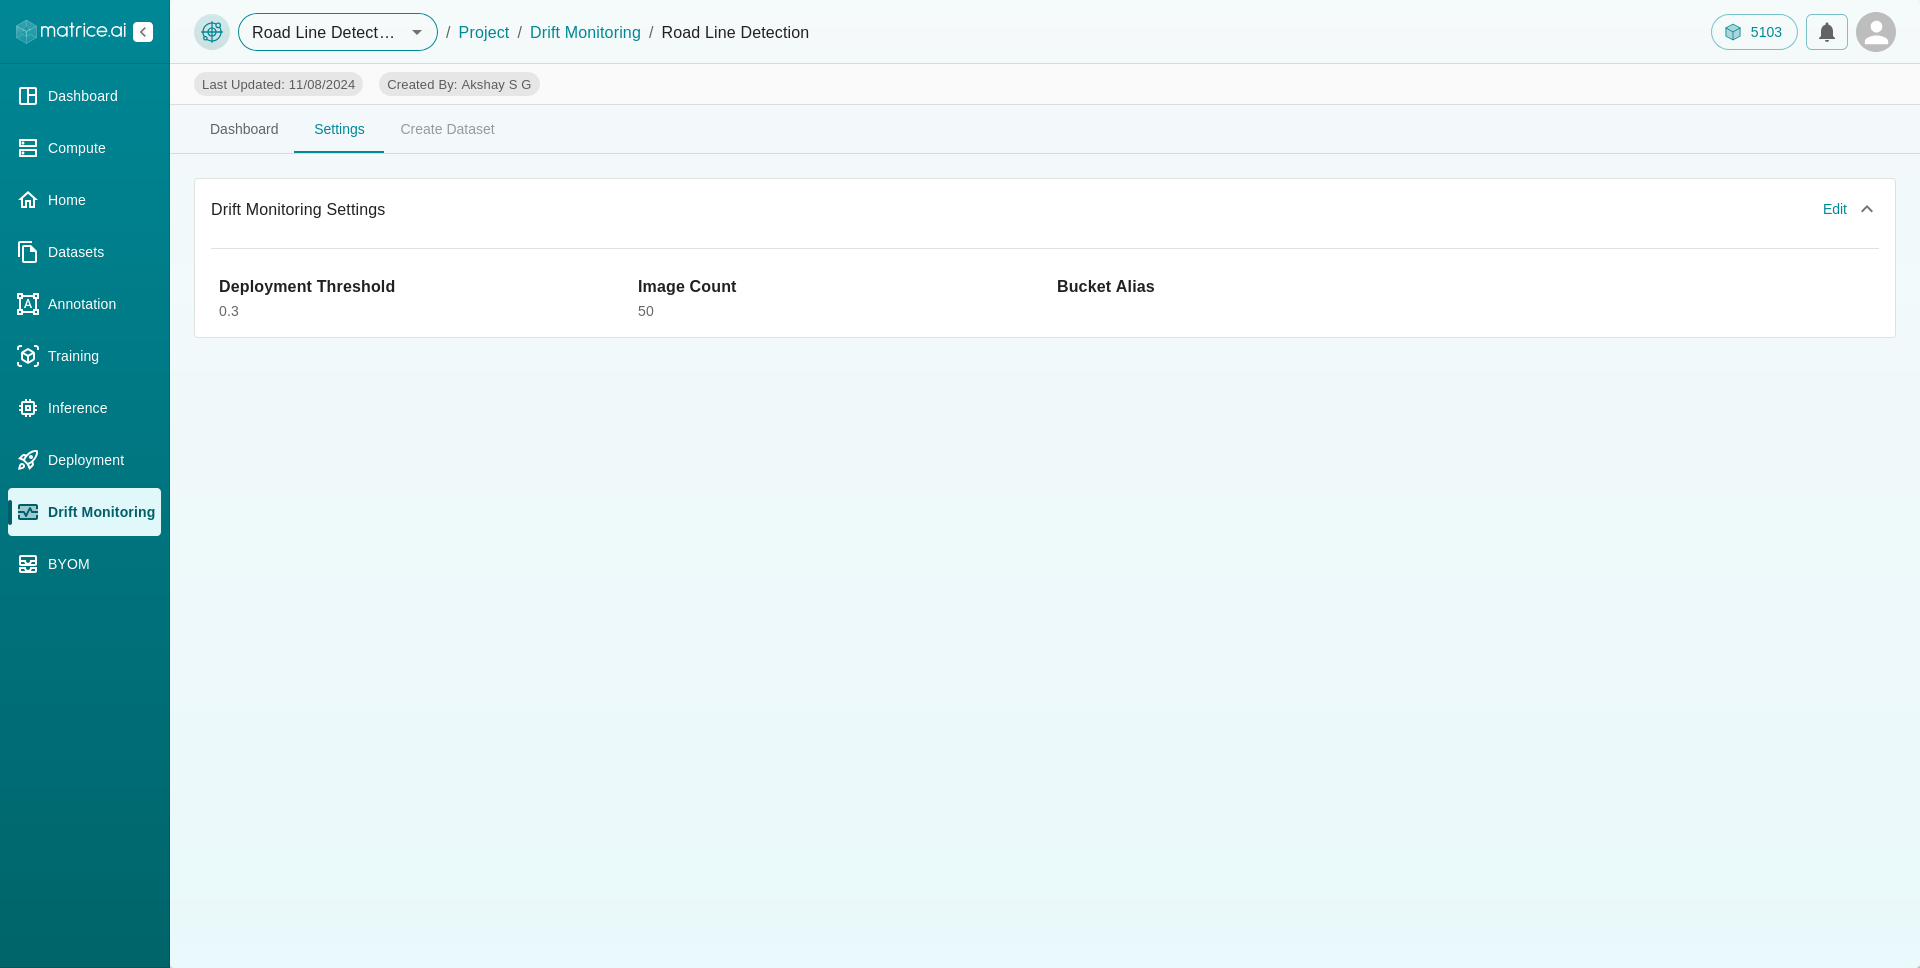
Settings: If you need to modify any settings of the drift monitor, such as the Image Store Count Threshold or Image Store Confidence Threshold, you can do so under this tab by clicking the edit option.
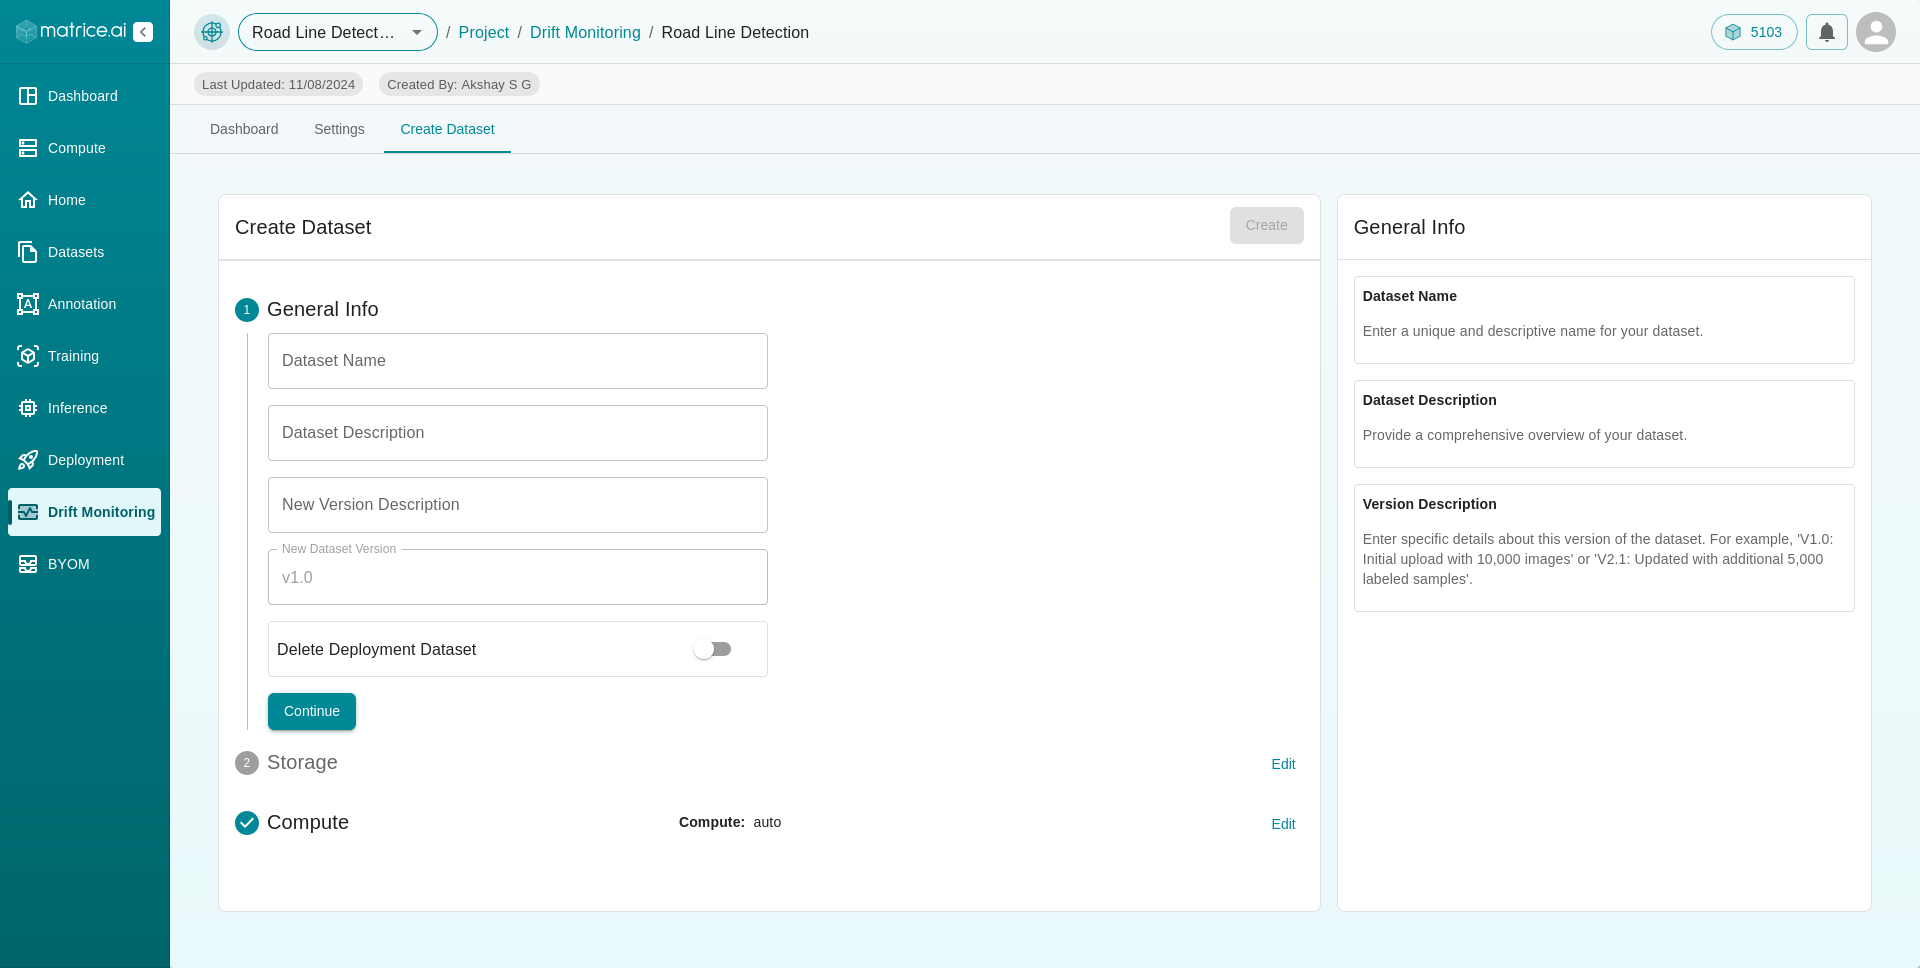
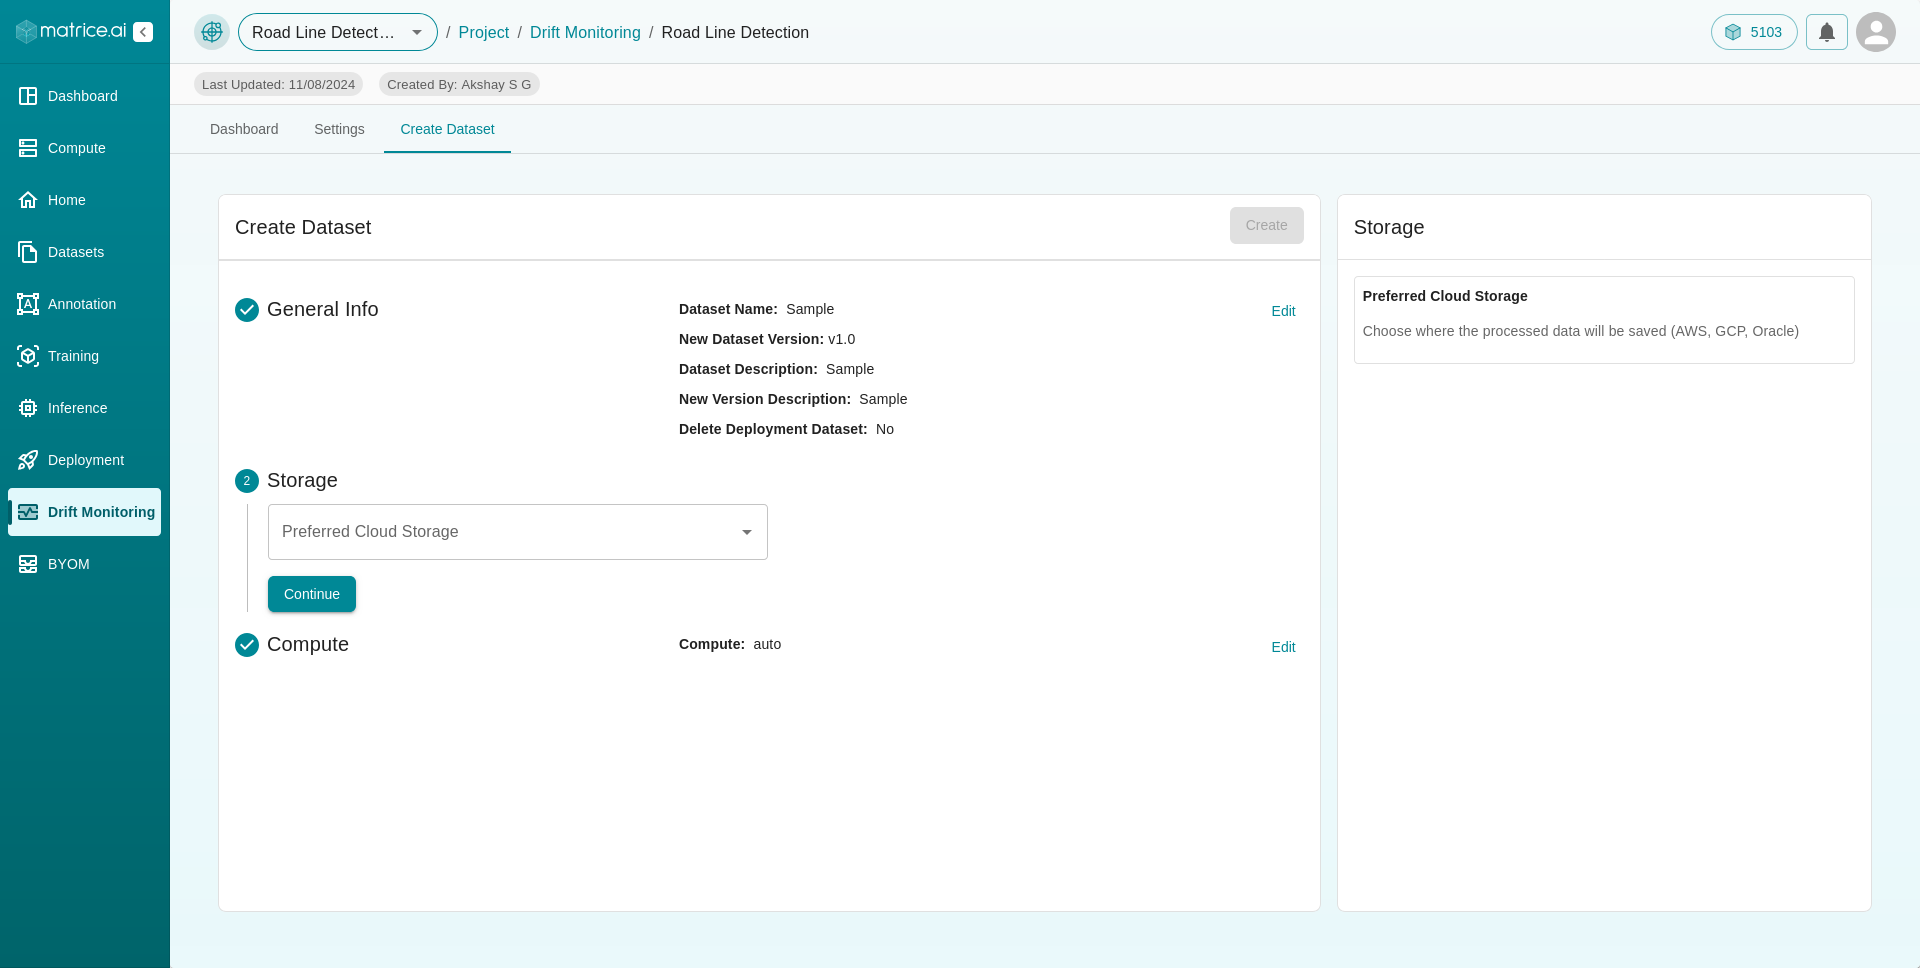
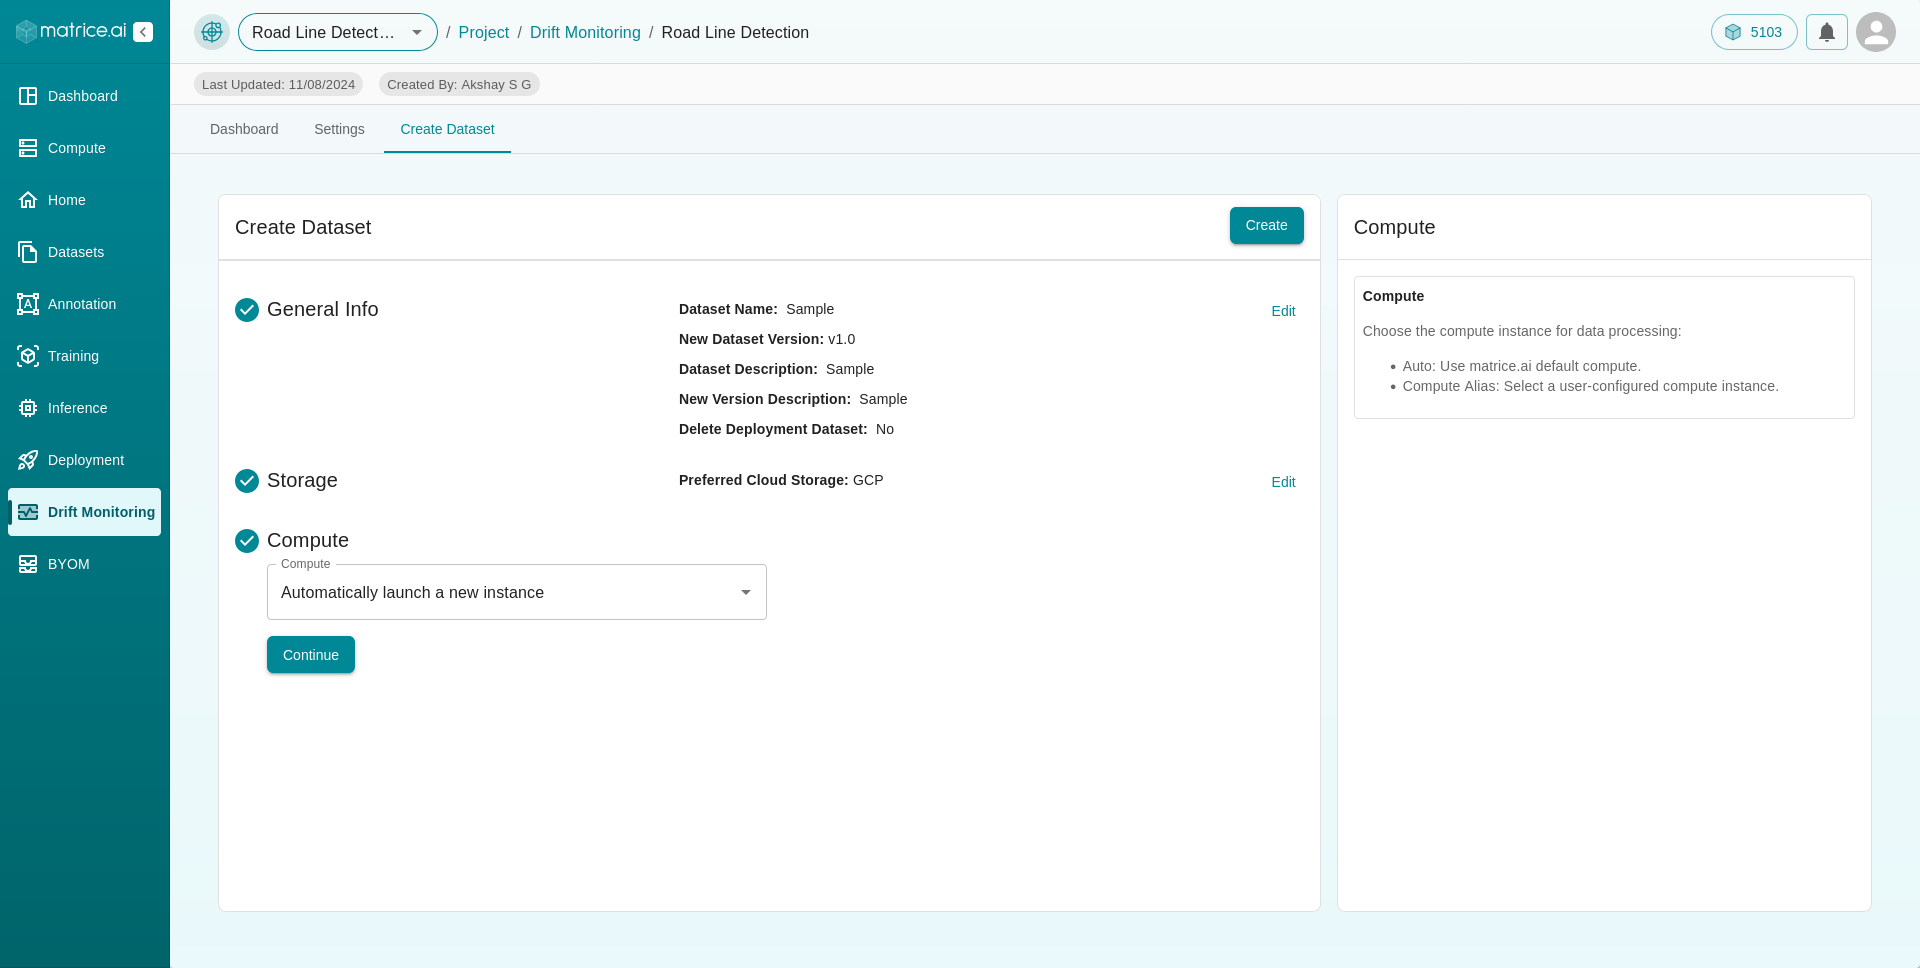
Create Dataset: This tab allows you to create a new dataset from the images used in predictions. Only those images with confidence scores greater than or equal to the set Image Store Confidence Threshold are included. The images will be stored once the Image Store Count Threshold is reached.