Manage Models
To view and manage your models, follow these steps:
Access the Experiment: Click the
+button next to the experiment you want to access. This will reveal the models associated with that experiment.Select a Model: Click on the model you want to manage. This will take you to the model management dashboard where you can manage your trained model.
Model Management Dashboard
The model management dashboard provides various tabs to help you view, analyze, and manage your trained model. Here are the details of each available tab:
Summary
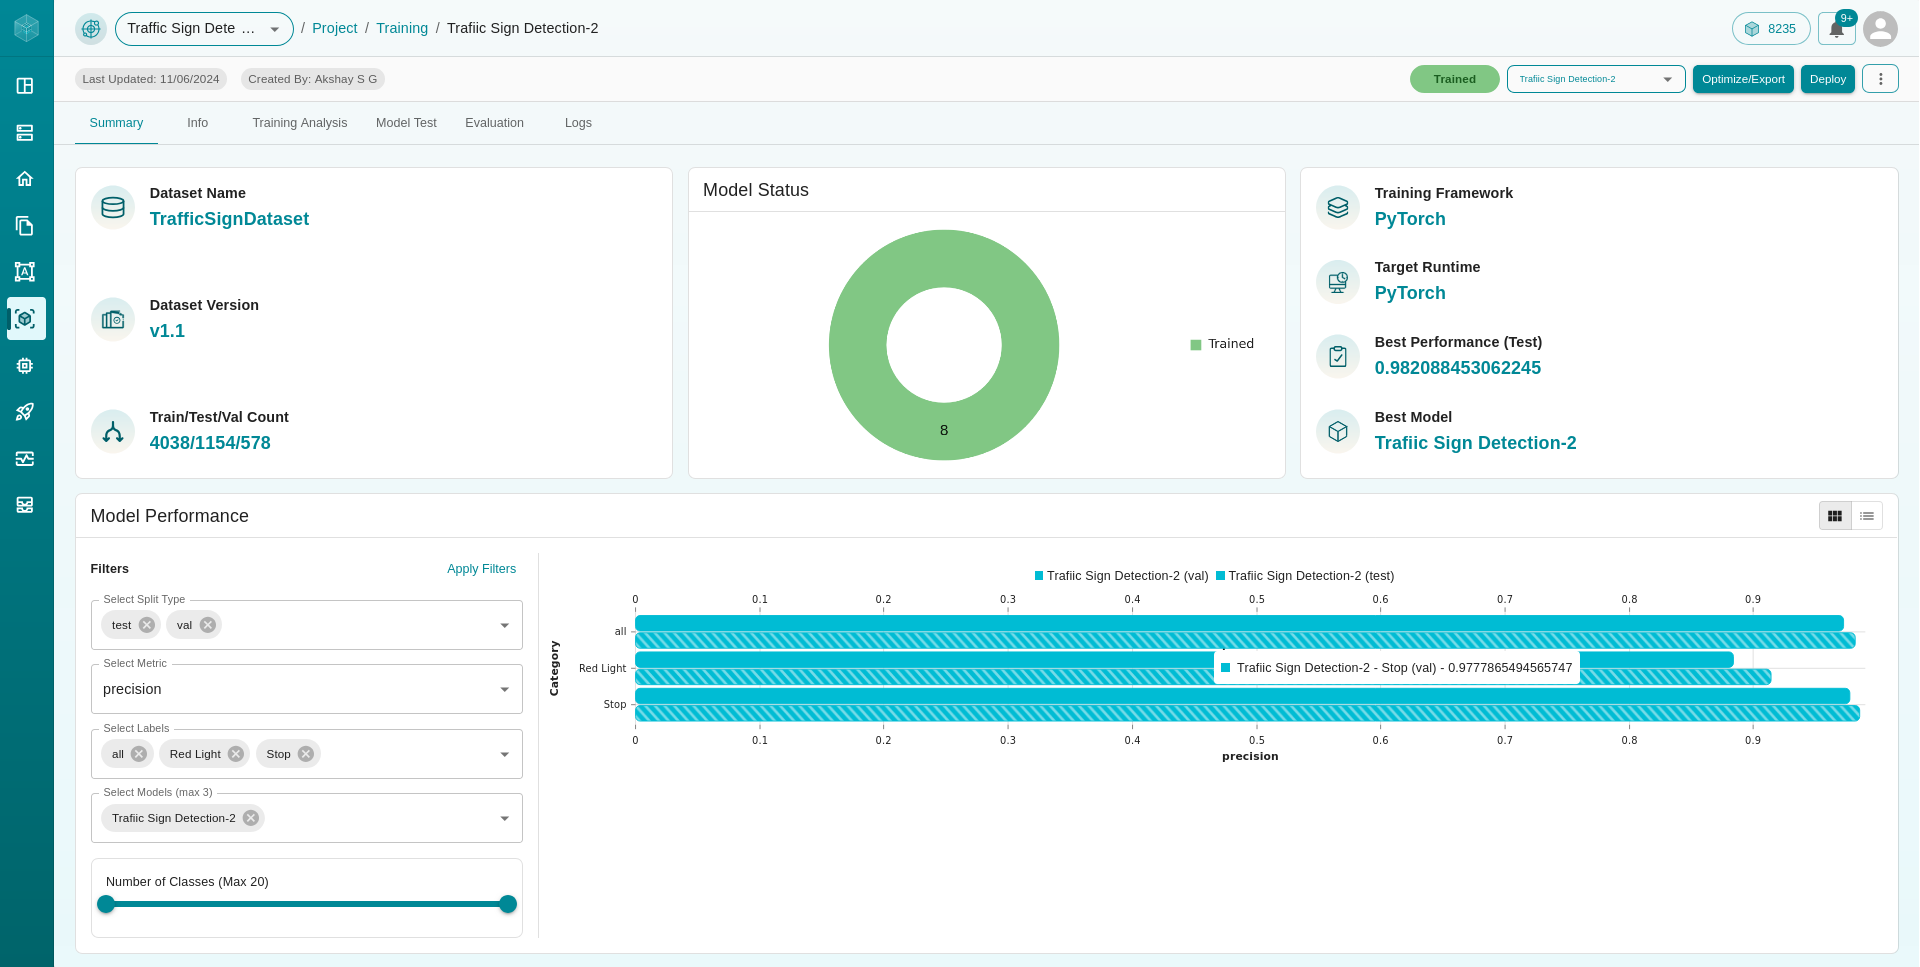
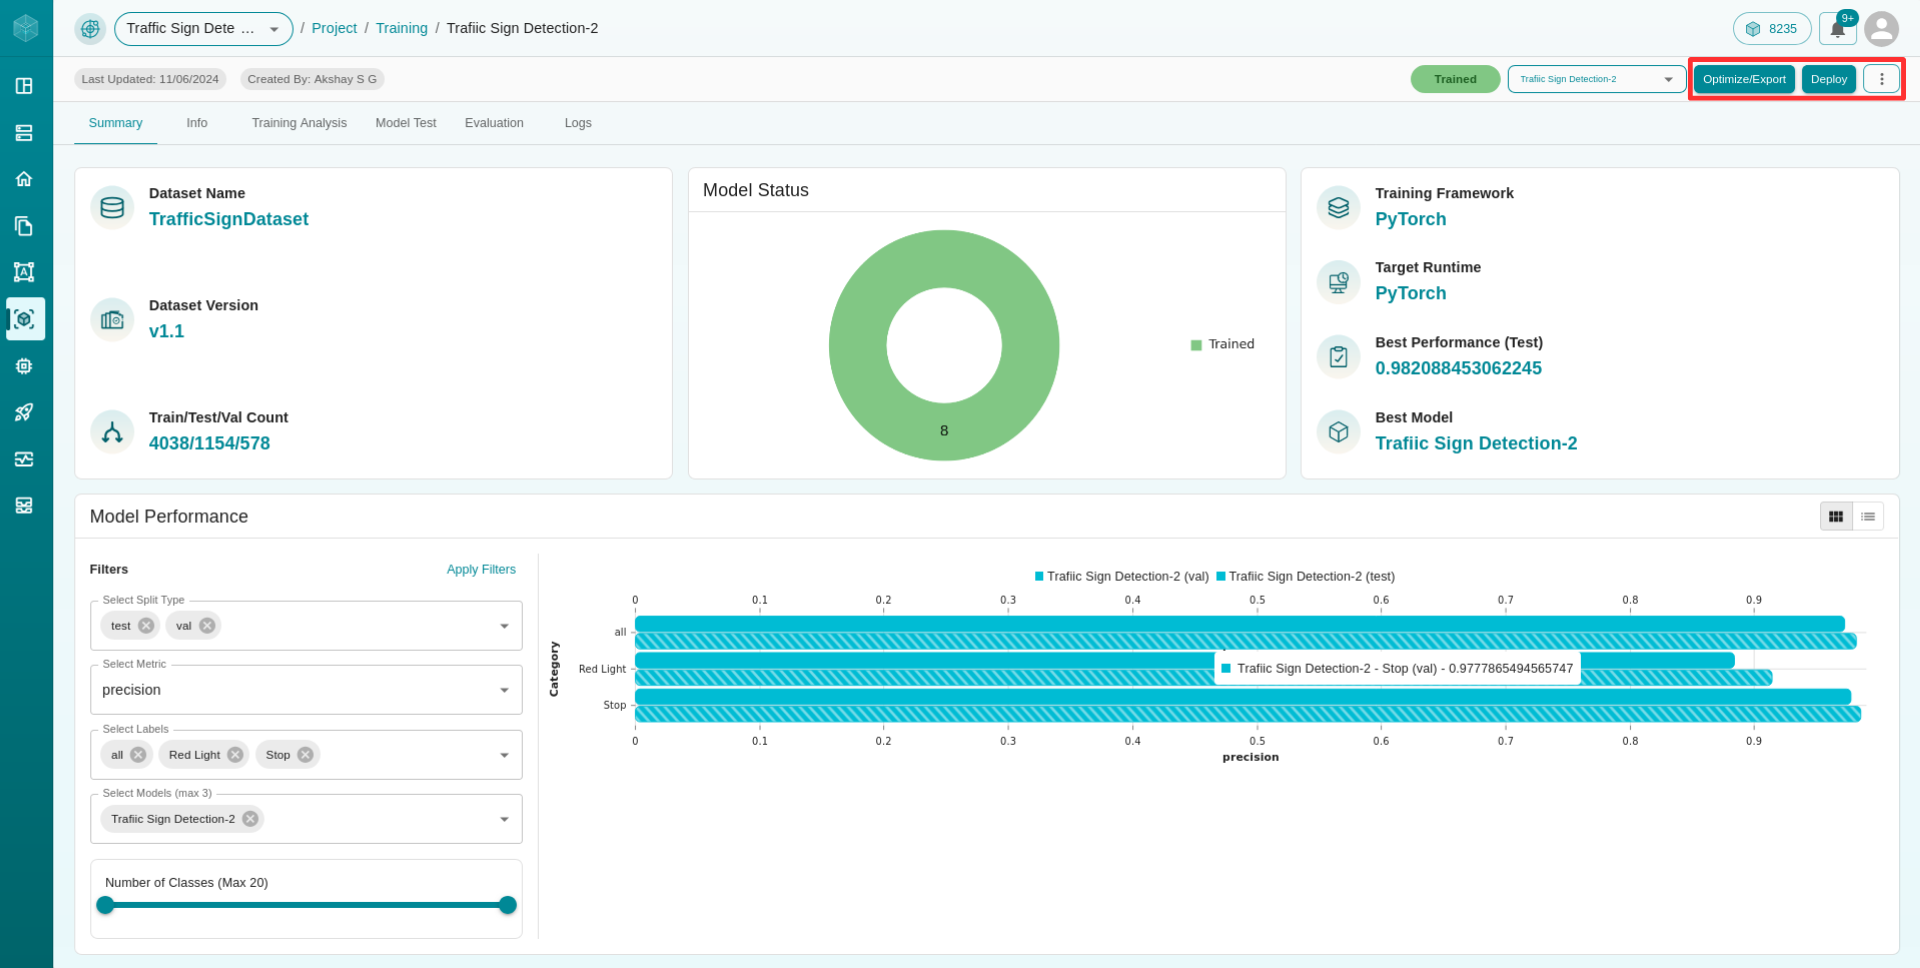
The Summary tab provides an overview of your model’s training and performance:
Dataset Details: Displays information about the dataset the model has been trained on, including the name, version, and split count.
Model Status: Shows the current status of the model (e.g., queued, training, trained).
Training Information: Provides details about the model’s training, such as the training framework, target runtime, best performance, and best model.
Model Performance Graph:
X-Axis: Represents the primary metric you specified when adding the model.
Y-Axis: Displays all categories or classes in the dataset.
Info
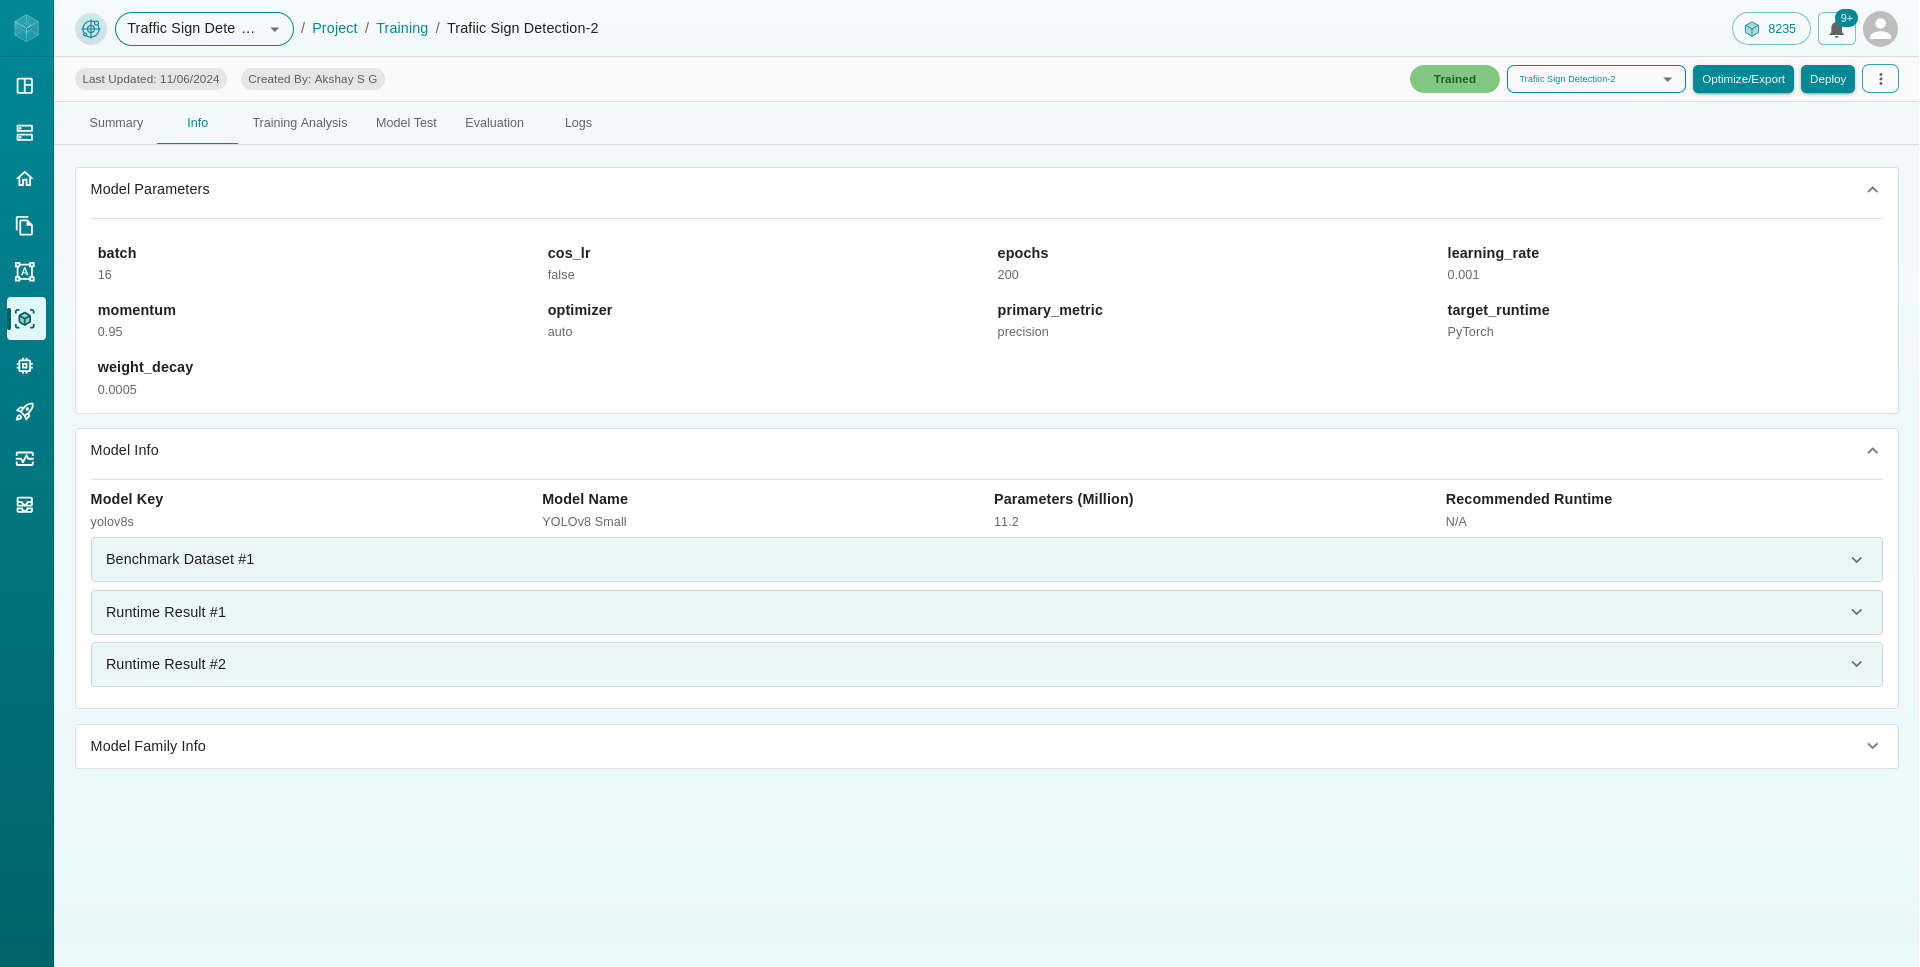
The Info tab provides detailed information about the model:
Model Family: Displays the model family information.
Model: Specific model details.
Model Parameters: Lists all the parameters used during the model’s training.
Training Analysis
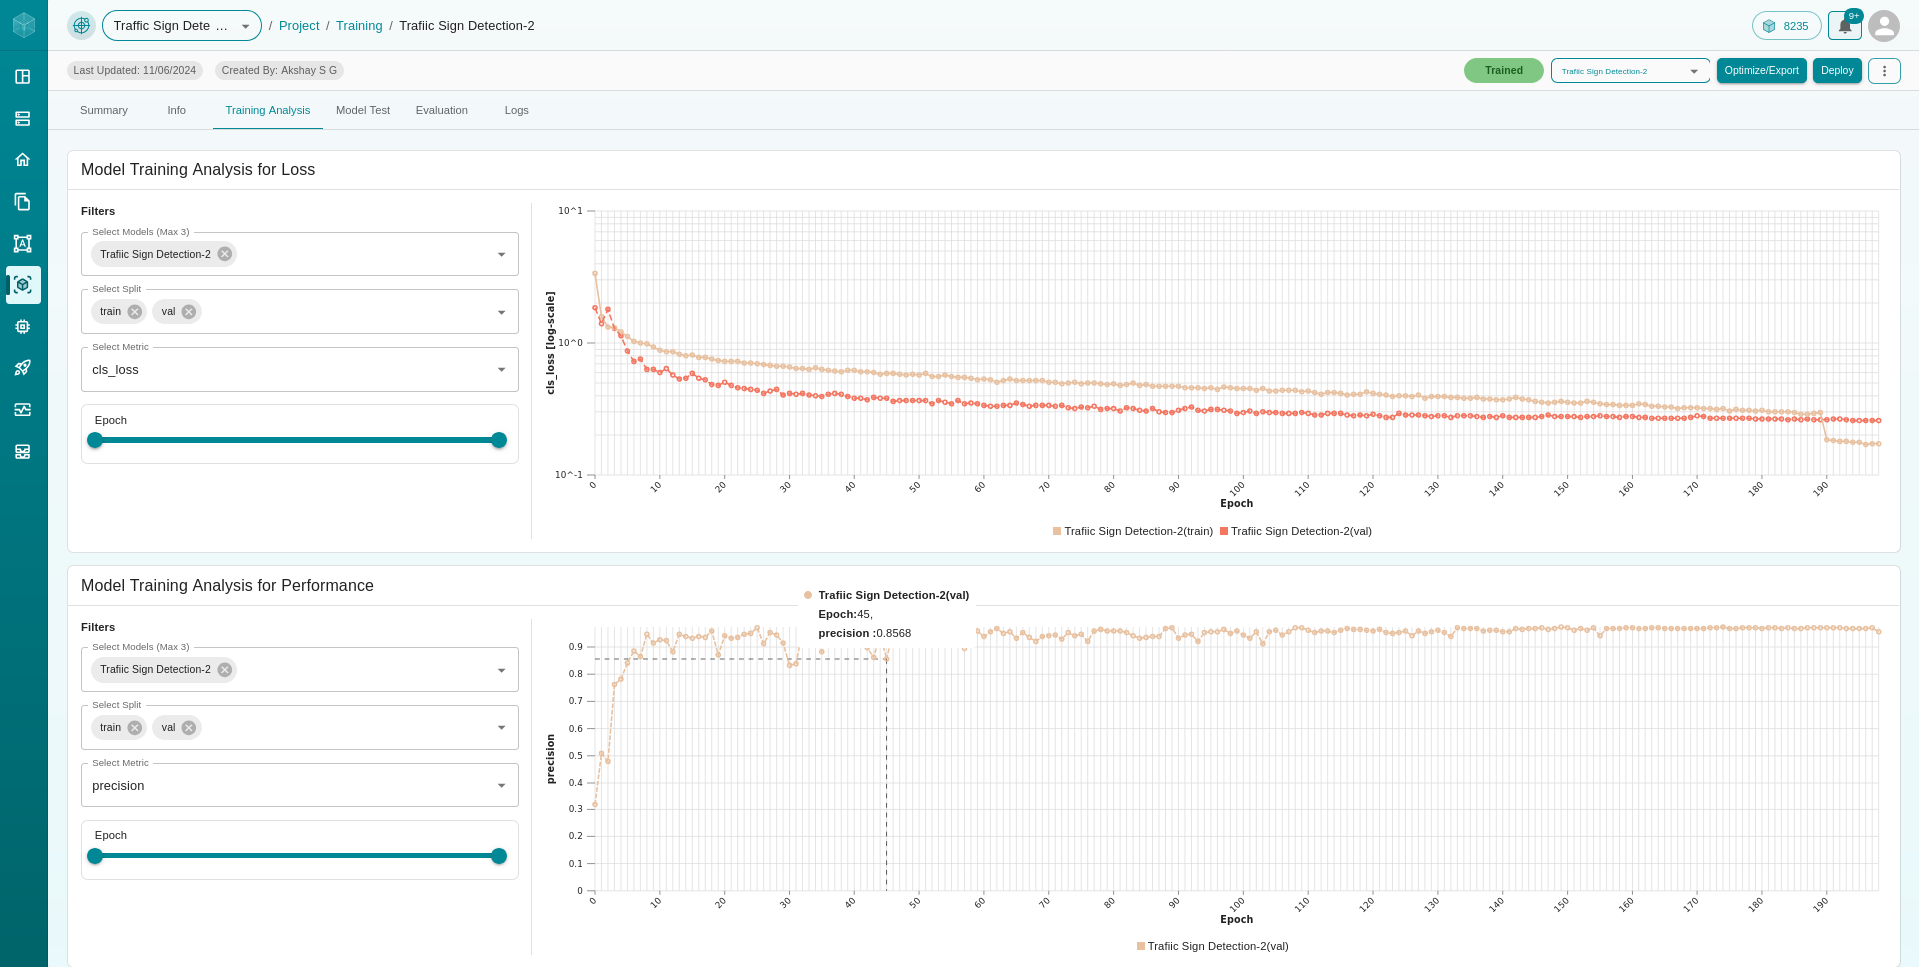
The Training Analysis tab offers charts that allow you to analyze the training process:
Loss Analysis: A chart displaying
epoch vs loss, helping you understand how the loss changes over time during training.Performance Analysis: A chart showing
epoch vs accuracy, providing insight into how the model’s accuracy improves with each epoch.
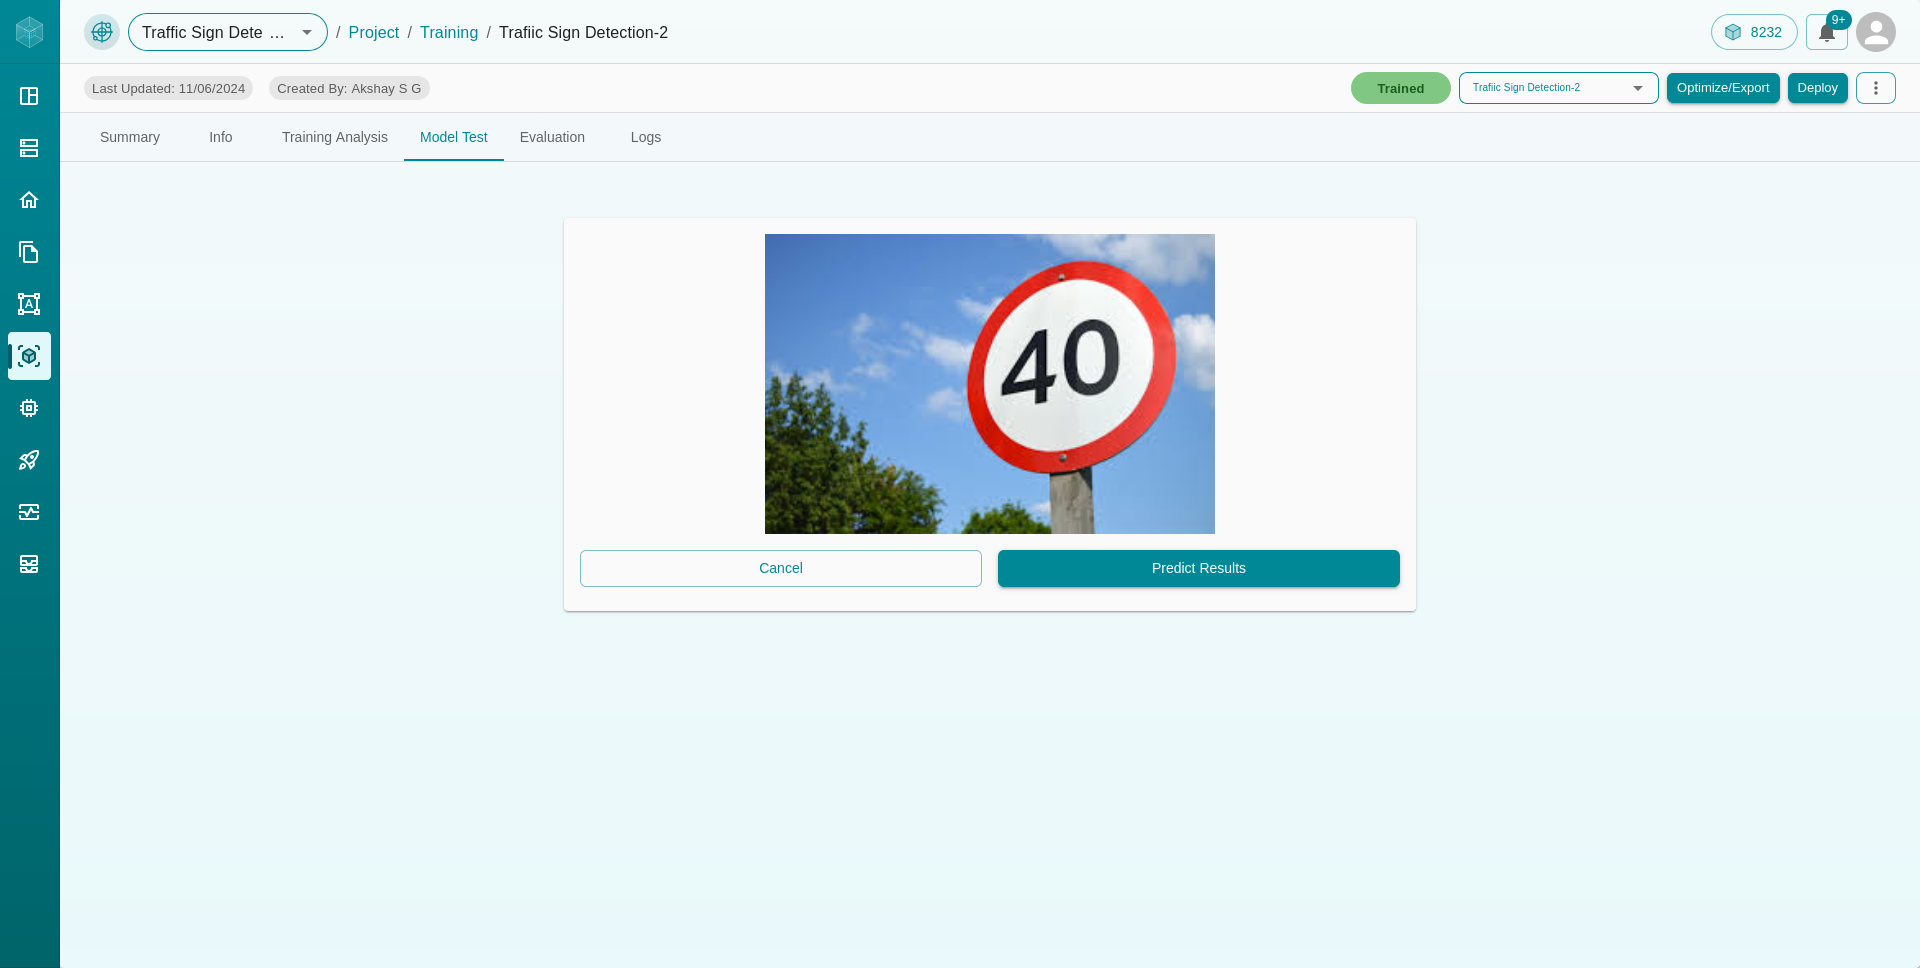
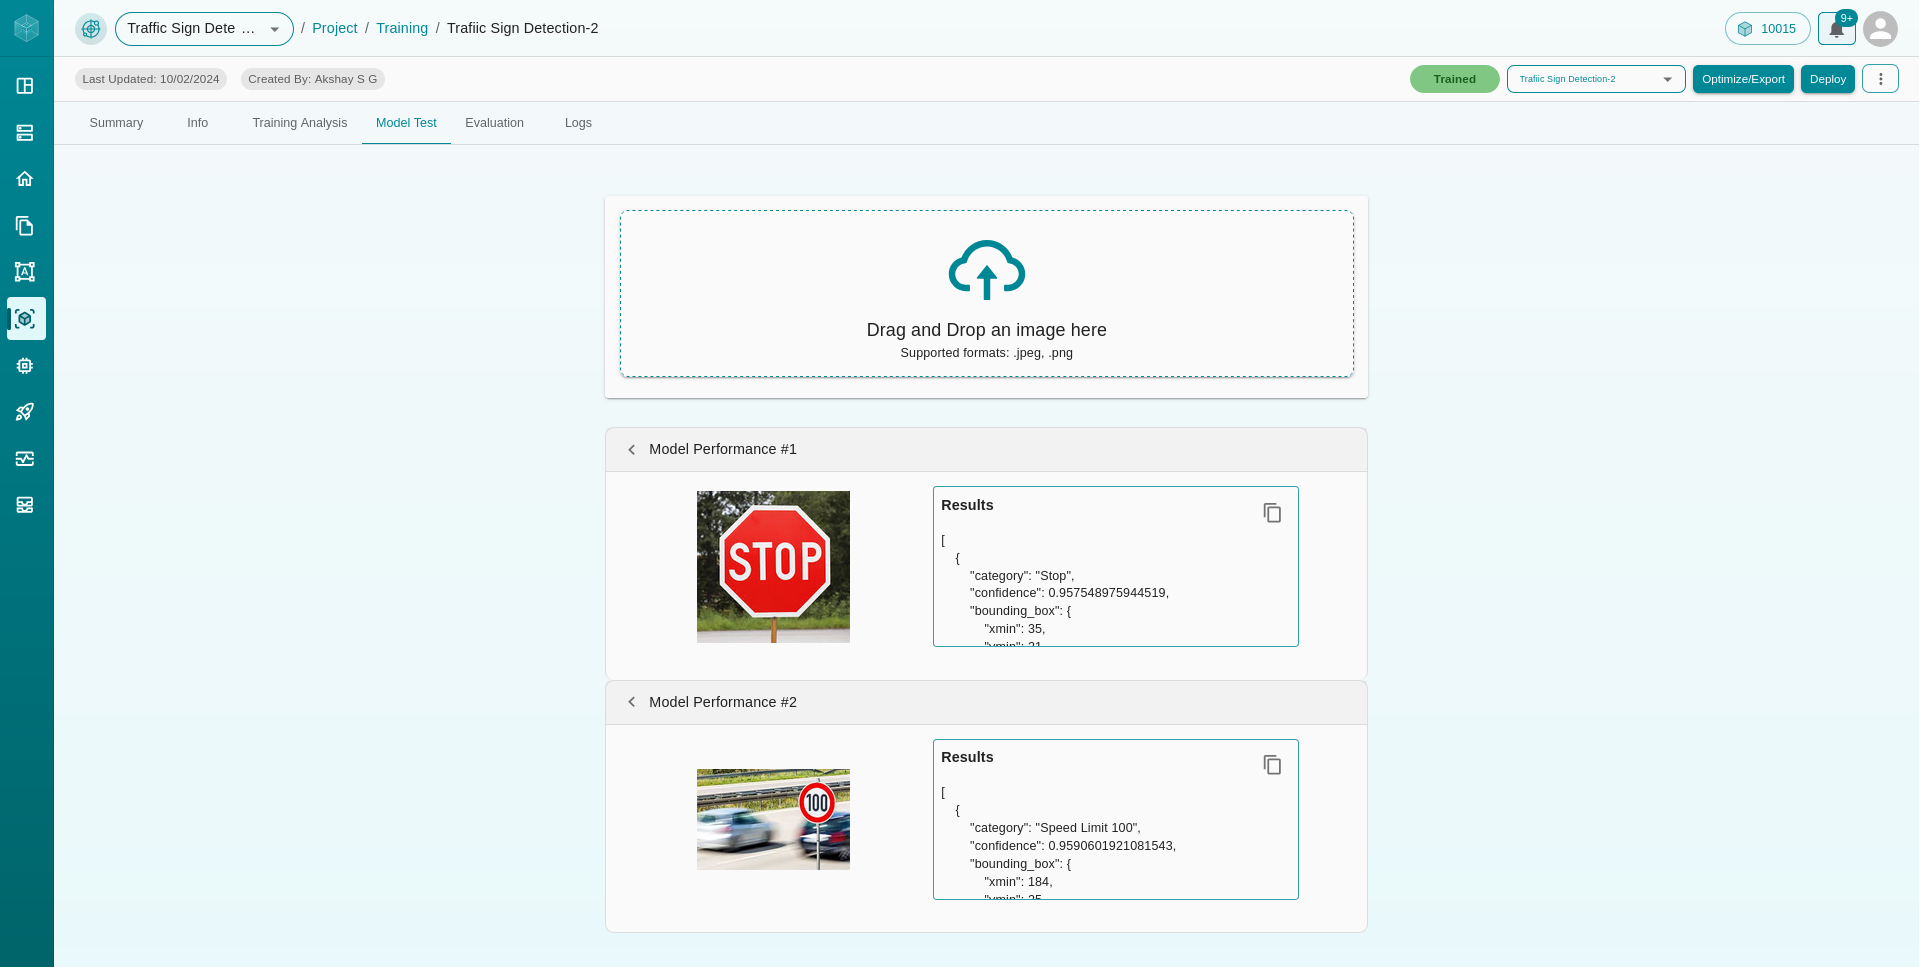
Model Test
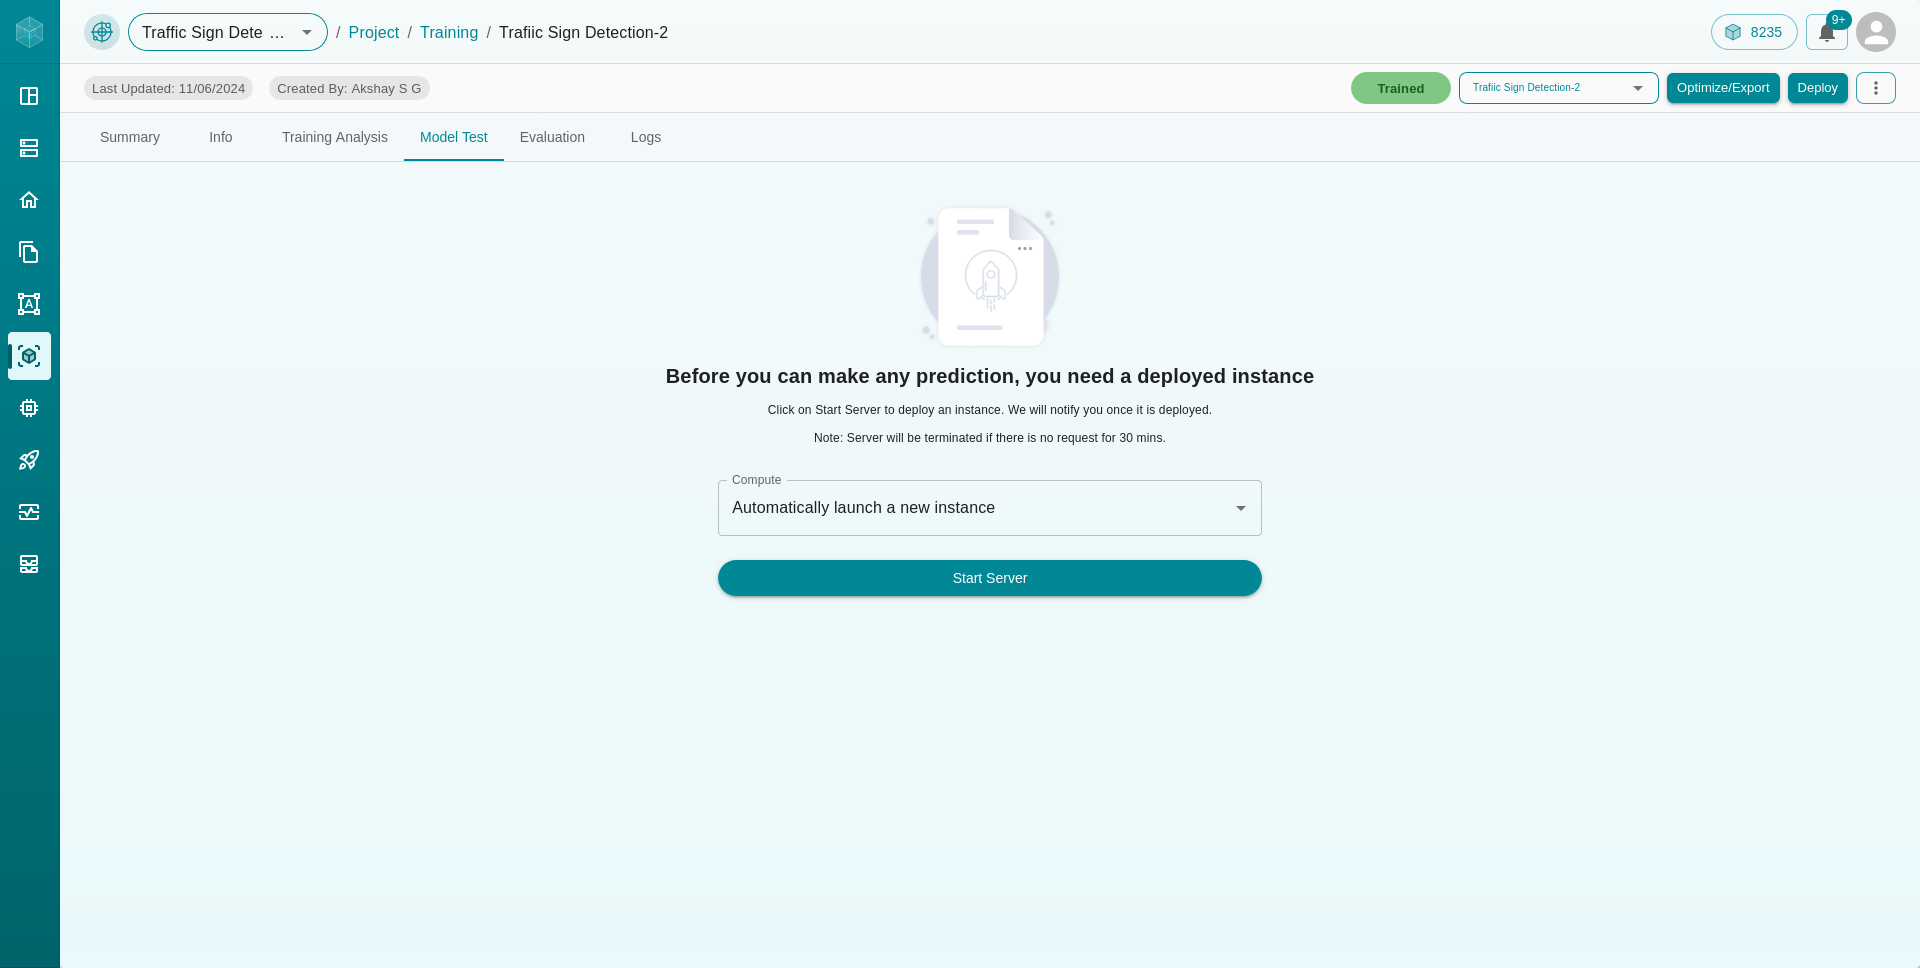
The Model Test tab allows you to make predictions using your trained model:
Start Server: Before making predictions, you need to deploy an instance by clicking the
Start Serverbutton. It will take some time to start, and you’ll be notified once the server is deployed.
Making Predictions: Once the server is deployed, you can drag and drop your images or choose them from your file system. Click the
Predict Resultsbutton to predict using your uploaded image.Classification Project: The output will be the class of the image.
Detection Project: The output will be the image with bounding boxes drawn around detected objects.
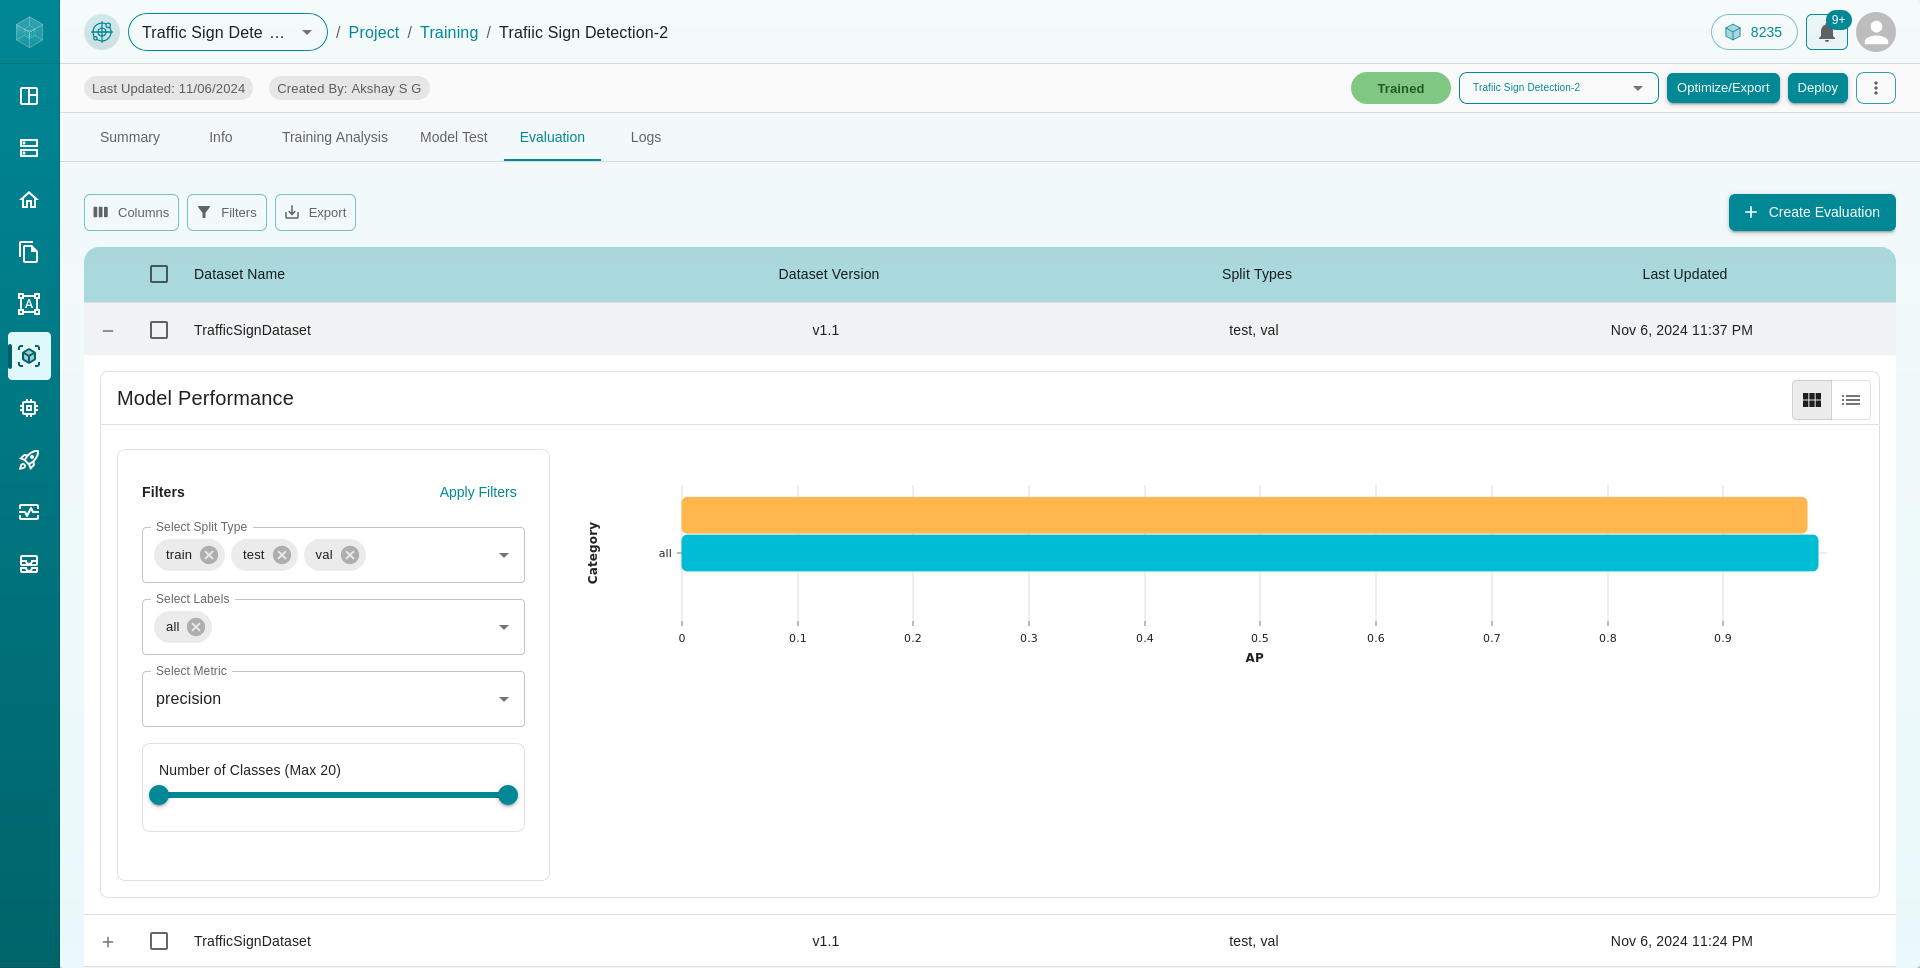
Evaluation
The Evaluation tab allows you to evaluate your trained model on any data split (train/test/val). To view the evaluation graph, click the + icon to the left of the evaluation name in the table within the Evaluation tab.
Evaluation Graph: Evaluates your model on the selected data split and displays a graph showing
category vs accuracy.
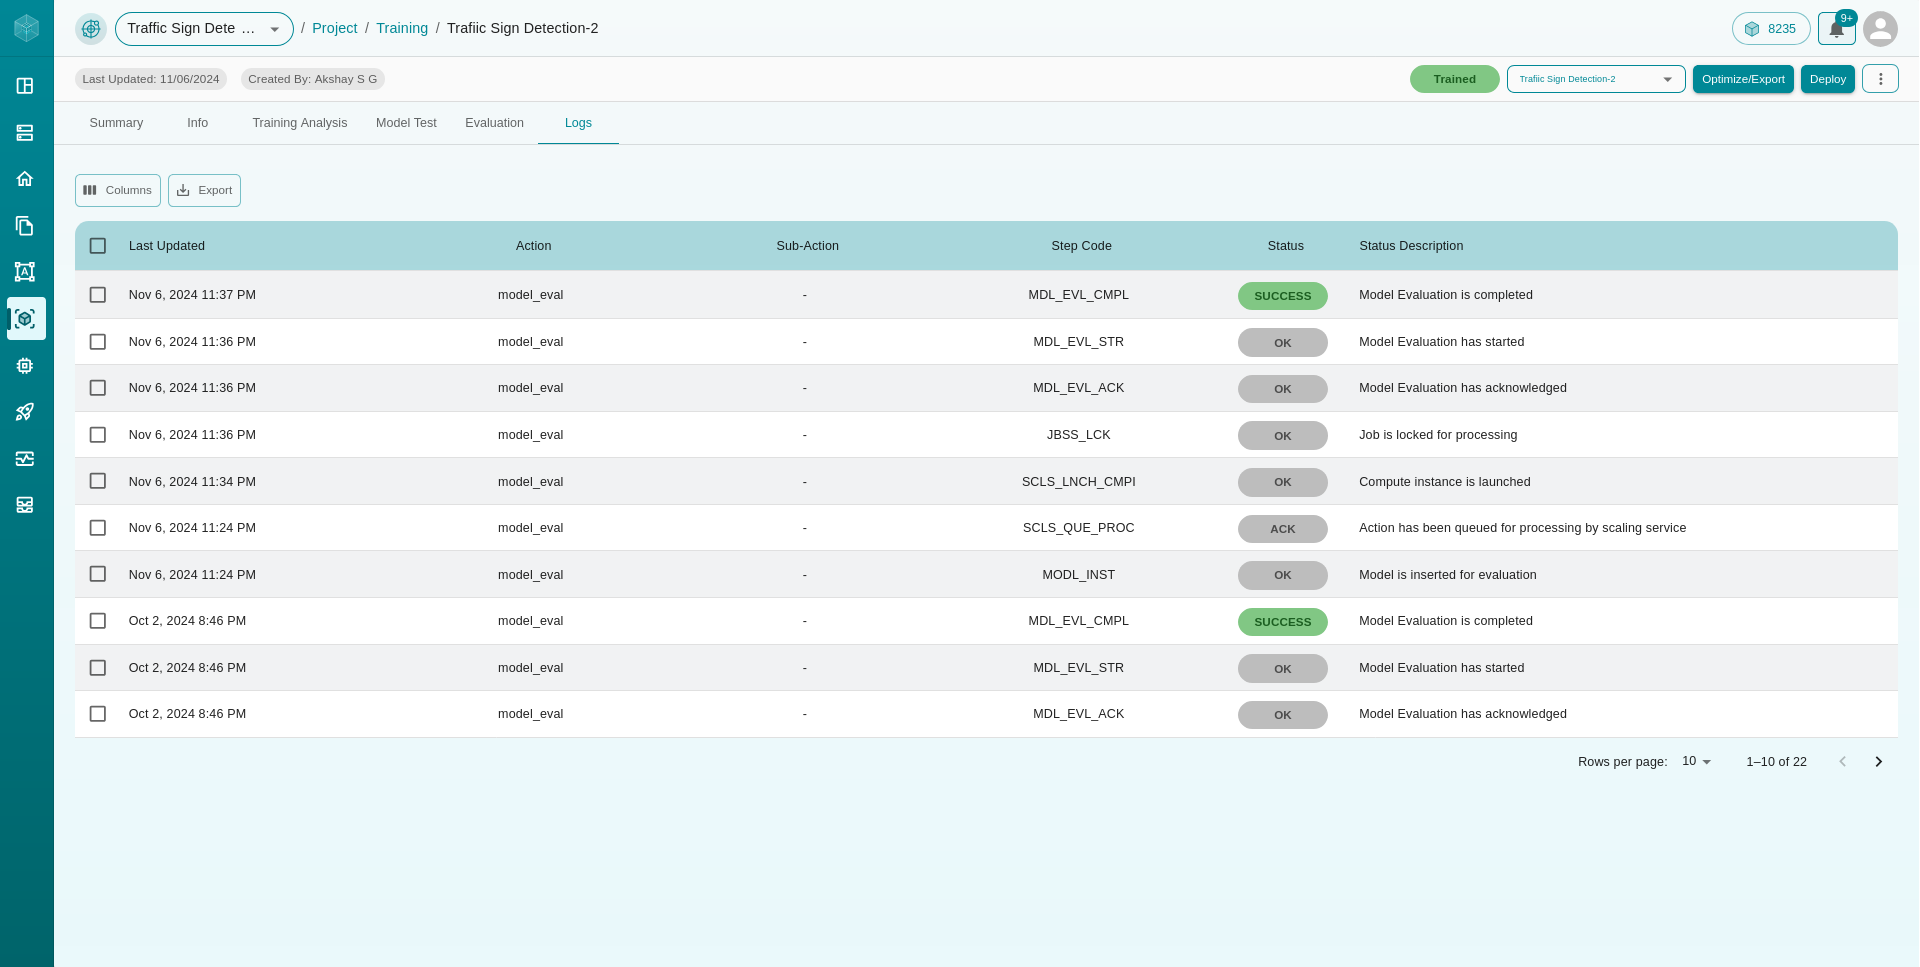
Logs
The Logs tab displays logs associated with model training. This includes details such as:
Last Updated
Action
Sub-Action
Step Code
Status
Status Description
These logs help you identify the stage of training your model is in, and provide error messages with descriptions if any issues occur, as well as success messages.
Important Dashboard Buttons
In addition to the tabs, there are a few important buttons located on the top-right corner of the page:
Optimize/Export: Clicking this button will take you to the Inference platform, where you can further optimize or export your model. This will be explained in more detail in the inference tutorials.
Deploy: This button takes you to the deployment platform, where you can deploy your trained model. This will be covered in the deployment tutorials.
Three Dots Button: Clicking on this button reveals additional options, including:
Delete Trained Model: Allows you to delete the trained model. The procedure follows the same steps as deleting models mentioned earlier.
Rename Trained Model: Allows you to rename the trained model, again following the same procedure as renaming models mentioned earlier.
Download Trained Model: Allows you to download your trained model as a
.ptfile.
This comprehensive model management dashboard ensures that you have full control over your trained models, from analyzing their performance to deploying them for inference or further optimization.